Curated OER
Mapping the Aegean Seafloor
Earth science learners create a two-dimensional topographic map of the floor of the Aegean Sea. They use it to then create a three-dimensional model of the ocean floor features. This comprehensive resource delivers strong background...
Curated OER
Ping!
Using "mystery bathymetry" shoeboxes, young explorers simulate sonar action to map out the topography of an un-viewable landscape. This classic activity helps physical oceanography learners understand how sonar works. It would be...
NOAA
I Can't Breathe!
The Gulf of Mexico dead zone, an area of low oxygen that kills marine life, costs the United States $82 million every year. Young scientists research anoxic ocean environments then come up with a hypothesis for the cause of the Gulf of...
Curated OER
Giant Smelly Plant Attracts Thousands
Read and discuss a news article about a rare corpse plant that bloomed in Washington D.C. Because this native Indonesian plant blooms so rarely, people flock to see it. After reading the article, your class answers comprehension...
Curated OER
Right Place, Right Time
In this right place, right time activity, students read train timetables and apply the information to answer math word problems. Students solve eight word problems.
Forest Foundation
Forests, Carbon & Our Climate
To conclude their examination of forest ecosystems, class members consider the role forests play in the carbon cycle and how forests can offset climate change.
Curated OER
Breaking it Down
High schoolers will identify the factors that contribute to erosion and weathering. They will start by differentiating between chemical and mechanical weathering. They then apply what they learned by playing the online jeopardy game. Key...
Curated OER
Changing Planet: Rising Ocean Temperatures - Rising Sea Levels
As an anticipatory set, young environmental technicians watch a video about how ocean temperatures seem to be changing along with the global climate. They perform a laboratory demonstration with the purpose of observing what happens to...
Curated OER
World War I - The War Ends
Your class is in for a treat with this outstanding PowerPoint on World War I. The presentation is loaded with facts, maps, important personalities, and discussion questions on the war. Additionally, there is a wonderful video called,...
Curated OER
Natural Disasters and the Five Themes of Geography
Have your class do research on natural disasters and create a presentation using this resource. In completing this activity, learners apply the five geography themes to their research. They write a paper describing their results. It's a...
Curated OER
20,000 Leagues Under the Sea
Guide your class on an adventure 20,000 Leagues Under the Sea with this Hampton-Brown outline. It provides educators with a guide to increase reading comprehension, critical thinking, literary analysis, and reading strategies. This...
Curated OER
Irregular Familiar Commands
Irregular familiar commands are easy to understand with this chart, and there's a catchy tune provided to help you remember the irregular commands!
Curated OER
Who Would Win? Killer Whale vs. Great White Shark Storia Teaching Guide
Teacher guides are wonderful tools with tons of ideas that help you relate content in many different ways. Using the high-interest book, Who Would Win? Killer Whale vs. Great White Shark, learners hone their discussion and reading...
McAuliffe-Shepard Discovery Center
Global Warming in a Jar
This well-organized lab activity introduces earth science pupils to the greenhouse effect. They will set up two experiments to monitor temperatures in an open jar, a closed jar, and a closed jar containing water. Ideally, you would have...
US Environmental Protection Agency
Sea Level: On the Rise
With the global temperature on the rise, the effects of climate change are starting to be seen. However, many people have a difficult time conceptualizing the long-term effects, such as sea levels rising. Given an easy and effective...
US Environmental Protection Agency
Carbon Through the Seasons
Meteorologists view an animated video by the Environmental Protection Agency to learn how the carbon cycle works, and then move into groups to analyze and graph actual data of the atmospheric carbon dioxide concentration from Hawaii's...
Humanities Texas
A President's Vision: Thomas Jefferson
Here you'll find a fantastic resource for analyzing several primary sources regarding Thomas Jefferson's presidency, from his election and home in Monticello to the Lewis and Clark expedition and the Louisiana Purchase.
PHET
Planet Designer: Martian Makeover
Mars used to have liquid water, can you make it come back? Use the instructional activity and simulation to understand why Mars lost its magnetic field, why atmosphere is important, and what gravity has to do with it. This is the third...
PHET
Planet Designer: Retro Planet Red
What does the atmosphere on Mars look like? This fourth instructional activity in the series of five is designed for high schoolers. Scholars apply previous knowledge to add atmosphere to Mars in an online simulation. This comprehensive...
National Wildlife Federation
Why All The Wiggling on the Way Up?
Some of the CO2 emitted by burning fossil fuels is removed from the atmosphere by natural sinks, such as the ocean. The fifth engaging lesson in the series of 21 examines the CO2 data from three very different locations. It then makes a...
National Wildlife Federation
The Tide is High, but I’m Holding On… Using ICESat Data to Investigate Sea Level Rise
Based on the rate of melting observed from 2003-2007 in Greenland, it would take less than 10 minutes to fill the Dallas Cowboys' Stadium. The 17th lesson in a series of 21 has scholars use the ICESat data to understand the ice mass...
US Geological Survey
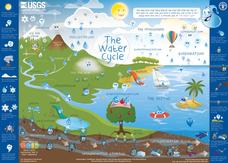
Water Cycle Poster
How many parts make up the water cycle? How many things on Earth rely on water as a system? Learn more about the water cycle in an informative and colorful poster. Print and hang, or project the graphic in the classroom for optimal use.
Curated OER
Sea Water Mixing and Sinking
Middle schoolers investigate the role of temperature and salinity in determining seawater density. They use a Temperature-Salinity Diagram to examine the effects of mixing on density.
Curated OER
Sea Water Freeze
Students observe how salinity affects the time it takes water to freeze. They participate in an experiment to determine that ice is essentially salt-free whether formed from fresh or salt water
Other popular searches
- Identify Oceans and Seas
- Oceans and Seas Maps
- Oceans and Seas Preschool
- Balm Oceans and Seas
- Oceans and Seas Worksheet
- Blm Oceans and Seas
- Major Cities/oceans/seas


