Reed Novel Studies
The Wednesday Wars: Novel Study
Teacher's pet or enemy? Holling, a character in The Wednesday Wars, feels his teacher is out to get him. However, he has to remain on his best behavior to ensure his father's business does not suffer. How will he ever survive 7th grade?...
Reed Novel Studies
Rascal: Novel Study
Some say a dog is a man's best friend. However, in Rascal, it is not a dog that captures a boy's heart—but a raccoon. Scholars read about the boy and Rascal's adventures while they complete activities about the story. Activities include...
California Education Partners
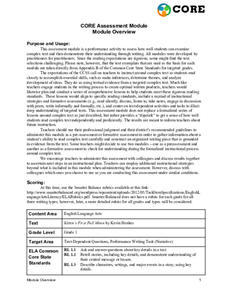
Kitten's First Full Moon by Kevin Henkes
A 3-day exam assesses readers' comprehension. After hearing a passage from the story Kittens First Full Moon by Kevin Henkes, scholars work with a partner to discuss and sketch what they found memorable. Peers share their final products...
Equality and Human Rights Commission
Learning area 4: Learn About the Meaning of Community
Scholars examine the jobs found in their community by way of surveying. After collecting data, pupils analyze their findings and share their observations with their peers. A video sparks interest. Two posters motivate participants to...
Workforce Solutions
Reality Check
Scholars complete the Reality Chech handout that identifies their potential salary given a specific profession. Pupils examine the lifestyle options and choose what they wish to have; however, each item costs money and, depending on how...
K20 LEARN
Do Hungry Dragons Really Like Crunchy Tacos?: Adjectives
Tacos are the theme of a lesson all about adjectives. Scholars list as many adjectives as possible to describe tacos and play a game of Not Like the Others before reading Dragons Love Tacos by Adam Rubin. Peers guess their favorite foods...
Anti-Defamation League
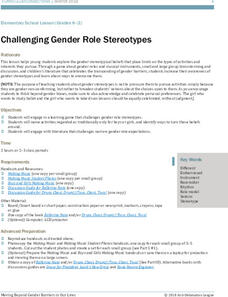
Challenging Gender Role Stereotypes
Through thoughtful discussion and a read-aloud, scholars challenge gender role stereotypes. Pupils examine pictures and collaborate with their small groups to debunk stereotypes. They explain what gender role stereotypes they know of and...
Curated OER
Let's Get Physical
Students collect data using the CBL. In this statistics lesson plan, students predict the type of graph that will be created based on the type of activity the person does. The graph represents heart rate depending the level of activity.
Curated OER
Statistics
In this statistics worksheet, students solve 2 problems that involving plotting data, recognizing ordered pairs, and analyzing the graphed relationship.
Curated OER
Statistics
In this statistics learning exercise, students view 6 graphs to determine the correlation. Students then answer 4 questions that involve plotting data, determining a relationship, and making predictions.
Curated OER
Problem Solving Strategies: Pre Test
In this problem solving learning exercise, students answer multiple choice questions about math word problems and choosing the best strategy to solve them. Students answer 10 questions total.
Curated OER
Graphing Scatterplots
Young scholars examine scatterplots and determine the equation of a line using the slope-intercept method. Students interpret graphs, draw inferences, and sketch a curve of best fit for the graph. Based upon patterns in the graphs,...
Curated OER
Adjective or Adverb?
In this language arts activity, students read 30 sentences that have missing words. Students choose the adjective or adverb which best fits the sentence. There is no instruction on the page.
Curated OER
Articles
In this articles worksheet, learners determine which article, a or an, best fits 16 phrases. Students write in a or an in front of each noun.
Curated OER
Grade 2 Daily Language Review Worksheet
In this language review worksheet, 2nd graders choose whether 2 statements are real or make-believe, circle the multiple choice word that best fits 2 sentences, circle the word in 2 lines that is spelt correctly and fix the mistakes in 2...
Curated OER
Reading Nutrition Labels
In this nutrition worksheet, students name 2 food labels, then circle which label best fits a series of 12 statements such as "most sodium per serving," etc. Students then write about which item they think is more healthy and why.
Curated OER
Checking Test Comparability/Scattergrams
Students construct a scattergram graph. For this statistics lesson, students graph data by hand and using a spreadsheet program. They establish lines of best fit and draw conclusions using their graphs.
Curated OER
Matching the Five Senses
In this matching the five senses worksheet, students look at five pictures and write which one of the five senses best fits each one.
Curated OER
Probability Distributions
Students collect and plot data on a graph. In this statistics lesson, students analyze the distribution of a sample and predict the outcome. They find the line of best fit and discuss what would make the sample larger.
Curated OER
Black Out
Students collect and analyze data. In this statistics lesson, students plot their data on a coordinate plane and find the line of best fit. They calculate the linear regression using the data.
Curated OER
From Playing with Electronics to Data Analysis
Students collect and Analyze data. For this statistics lesson, students identify the line of best fit of the graph. They classify lines as having positive, negative and no correlation.
Curated OER
Modeling Population Growth
Young scholars collect data on population growth. In this statistics instructional activity, students graph their data and make predictions. They find the linear regression and the best fit line.
Curated OER
Seedfolks Character Chart
There are quite a few characters in Paul Fleischman's Seedfolks, so why not help your class keep track of them? Learners can mark up this chart to show the traits that apply to each character. Along the left, each character is listed,...
Curated OER
Statistics
In this statistics activity, 8th graders solve and complete 2 multiple choice problems that include determining statistics. First, they determine the equation that best represents the data shown on the scatterplot. Then, students use the...


