Curated OER
The Perfect Cow?
Students examine how cattle have evolved through natural selection and selective breeding. In this natural selection lesson students compare and contrast natural and artificial selection.
Curated OER
When Gifted Kids Are Bullied
There are many effective ways to reduce bullying in school.
Curated OER
Calculator-Based Lessons Help Examine Real-World Data
Students may determine equations based on graphs and regression models.
Curated OER
Homeschooling Chronicles - Summer Book Ideas
With summer reading programs in full swing at local libraries, here are some selections you can use to pique everyone's interest.
Curated OER
Buzz Up My Hive
Students research bees. In this organisms lesson plan, students participate in various learning centers to find out more about bees. The centers include watching a video and taking notes, reading books about bees, and going on a...
Curated OER
Piecewise Modeling with Multiple Functions: Federal Debt
High schoolers analyze data on debt and write an equation. In this statistics lesson, students are given data from different time periods, and are asked to graph and analyze the data. They work in groups, and are assigned different parts...
Curated OER
Lesson Plan On Fran Data
Seventh graders investigate the concept of functions and how they are used in the context of the real world while identifying the dependent and independent variables. They graph relations and functions and find the zeros of functions....
Curated OER
Introduction To Data Analysis
Seventh graders investigate the concept of looking at the data put in a variety of ways that could include graphs or data sets. They analyze data critically in order to formulate some sound conclusions based on real data. Students graph...
Curated OER
Confusing Colors!
Fourth graders collect data, graph their data, and then make predictions based upon their findings. They's interest is maintained by the interesting way the data is collected. The data collection experiment is from the psychology work of...
Curated OER
Statistical Accuracy and Reliability
Ninth graders assess the accuracy and reliability of current survey data and how it is represented. They design a survey, collect data, and use technology to analyze the data and present the results. Students examine scatter plots and...
Curated OER
Western Hemisphere
Fourth graders use a database to compare countries in the western hemisphere. They describe a variety of regions in Texas and the Western Hemisphere such as political, population, and economic regions that result from patterns of human...
Curated OER
On The Banks
Fourth graders write and perform an original song about Indiana. After learning the lyrics of the song "On the Banks of the Wabash," students write lyrics to their own song about Indiana with assistance from the instructor. They...
Curated OER
The Football and Braking Distance: Model Data with Quadratic Functions
Students engage in a lesson plan that is about the concept of data analysis with the use of quadratics. They use a Precalculus text in order to give guidance for independent practice and to serve as a source for the teacher to use. The...
Curated OER
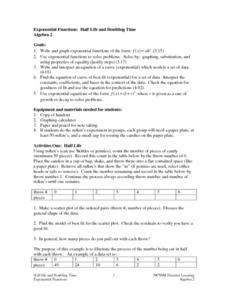
Exponential Functions: Half Life and Doubling Time
Pupils investigate the concept of exponential functions and how they increase in size over time. They simplify the functions in order to find the solutions that are possible and perform analysis of the curved line that is produced when...
Curated OER
M&M Exponential Activity
Students create a scatter plot of their experimental data. In this algebra lesson, students use M&M's to determine an algebraic model. They discuss results in class.
Curated OER
May The Fastest Toy Win
Students determine which wind-up toy is the fastest. However, they can NOT race the toys. They must find another way. On the first day of the activity, students work in pairs or small groups to develop and write a plan.
Curated OER
Salad Tray 3D Topographic Model
Students explore the characteristics of topographical maps. They examine the relationship of contour lines and vertical elevation. Students create a three-dimensional model of a landscape represented by a topographic contour map.
Curated OER
Viewing Tubes
Students complete a lab in order to discover if the length of a viewing tube, its diameter, or the distance from an object affect the type of data collected and the resulting graph.
Curated OER
The Bigger they Are . . .
Students do a variety of data analyses of real-life basketball statistics from the NBA. They chart and graph rebounding, scoring, shot blocking and steals data which are gathered from the newspaper sports section.
Curated OER
Walking the Plank
Eighth graders experiment with a bathroom scale, books and a plank to determine how weight readings change as distance is applied. They graph and interpret the results.
Curated OER
View Tubes
Eighth graders decide if the length of a viewing tube, its diameter, or the distance from an object affects the type of data collected and the resulting graph through a series of experiments.
Curated OER
Human Evolution
Young scholars make and use observations of Laetoli footprints to provide clues to life in the past. They collect and analyze data to study the relationship between foot length and body height.
Curated OER
Plot! Analyze! Draw your Conclusions!
Students download data reported from the Global Sun Temperature Project website. They graph and analyze the data looking for trends and patterns. They prepare a class report with their observations and post it to the website.


