CCSS Math Activities
Scatter Diagram
Don't let a great resource scatter to the winds. Pupils analyze two sets of test scores on a scatter plot. They draw a line of best fit and use it to make predictions about the test scores. They also consider any apparent trends in the...
Curated OER
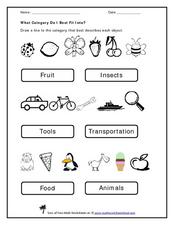
What Category do I Best Fit Into?
Use this pre-reading exercise to help learners sort familiar objects into categories. For each of these three sets, they draw a line from the object to the category in which it belongs. There are two categories for each set. If...
Florida Center for Reading Research
Multiple Meaning Words in Context
Multiple meaning words is the focus of a lesson designed to reinforce the use of context clues. Scholars listen carefully to a variety of sentences using the words pool and cast to decide which definition best fits the...
Radford University
Modeling the Number of Starbucks Stores
Drink your coffee, then marvel over the rise of Starbucks. Scholars use provided data on the number of Starbucks stores from 1987 through 2014 to create scatter plots. They then determine the equation for the curve that best fits the...
Radford University
Is it Really a Small World After All?
Working in groups, learners research four countries' populations over the past 30 years. Using the data collected, the teams find regression equations that best fit the data. Taking the regression equations, they then make predictions...
Curated OER
Equation of a Line
In this equation of a line worksheet, 9th graders solve and complete 4 different multiple choice problems. First, they use the median fit method to determine the equation that most likely represents the line of best fit for the data...
Curated OER
Linear Systems: Least Squares Approximations
In this least squares approximation worksheet, students determine the number of solutions a given linear system has. They find the least square error and the equation of a line of best fit for a set of three points. Students find the...
Curated OER
Data Analysis
In this data analysis worksheet, 8th graders solve and complete 4 different problems that include determining the line of best fit for each. First, they write the prediction for an equation for each situation described. Then, students...
Curated OER
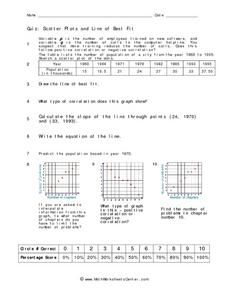
Quiz: Scatter Plots and Line of Best Fit
In this scatter plots and line of best fit worksheet, students create scatter plots from given sets of data. They answer questions concerning the scatter plot. Students write the equation of a line, identify the type of correlation...
Curated OER
Lines of Fit
Students solve equations dealing with best fit lines. For this algebra lesson, students solve problems by analyzing data from a scatterplot, and define it as positive, negative or no correlation. They classify slopes the same way as...
Curated OER
Lines of Fit
Students graph an equation and analyze the data. In this algebra lesson, students graph scatter plots and identify the line of best fit using positive correlation, negative correlation an d no correlation. They apply their data analysis...
Curated OER
Lines of Fit
Learners graph an equation and analyze the data. In this algebra lesson, students graph scatter plots and identify the line of best fit using positive correlation, negative correlation an d no correlation. They apply their data analysis...
PricewaterhouseCoopers
Paying for College: Finding the Right Fit
Most want to attend college, but do they know where? How will they afford it? How do they apply? Learners discover the costs associated with college and the best way to budget and possibly apply for financial aid.
Curated OER
Lines of Fit
Students analyze graphs. In this algebra activity, students find the line of best fit, using scatter plots. They calculate the sale of popcorn as it relates to the price. They then analyze the graphs for positive, negative and no...
Inside Mathematics
Population
Population density, it is not all that it is plotted to be. Pupils analyze a scatter plot of population versus area for some of the states in the US. The class members respond to eight questions about the graph, specific points and...
EngageNY
Modeling Relationships with a Line
What linear equation will fit this data, and how close is it? Through discussion and partner work, young mathematicians learn the procedure to determine a regression line in order to make predictions from the data.
Curated OER
Fitting Periodic Functions-Distant Planets
In this periodic functions activity, learners use given data of the speed of a star and find the best fit periodic function that follows the trend in data. They determine the amplitude, offset phase and the formula for the angle. They...
Mathalicious
Pic Me!
Finally! Math and Instagram have come together to discuss the correlation between likes and followers. High schoolers can't help but want to discover what makes one account more popular than another by developing a line of best fit and...
EngageNY
Analyzing Residuals (Part 2)
Learn about patterns in residual plots with an informative math lesson. Two examples make connections between the appearance of a residual plot and whether a linear model is the best model apparent. The problem set and exit ticket...
Radford University
Snappy Stair Sprints
Let's go for a run. Small groups determine a way to collect data to determine the time it would take to run a set of stairs. After creating a plan, teams collect data and graph their results, calculating the equation of best fit and...
Curated OER
Get a Half Life!
Eighth graders use M&M's to experiment with data. They use a graphing calculator to determine the best equation for their data; linear, quadratic or exponential. They analyze the data to find the half-life of their M&M's.
Curated OER
Curve Fitting
Pupils investigate linear, quadratic, and exponential regressions. They plot sets of data points, determine the regression equation that best fits the data and lastly investigate the coefficient of determination.
Curated OER
Linear and Exponential Functions
This comprehensive unit on linear and exponential functions provides numerous clearly-written worksheets. Topics include graphing linear equations, solving systems of equations algebraically and by graphing, identifying the domain and...
Institute of Electrical and Electronics Engineers
Sugar Crystal Challenge
Blow your learners' minds with a sweet lesson on nanotechnology that uses sugar to demonstrate the difference nanoscale surface area makes in dissolving and crystal formation. Plenty of supportive background information is read to...


