Curated OER
Homonyms Worksheet 1
In this grammar worksheet, students underline the appropriate word in parentheses that best fits twenty-one sentences. Students check to make sure each sentence is grammatically correct.
Curated OER
Exploring Linear Equations And Scatter Plots - Chapter 5 Review
Young scholars complete rolling stocks experiment, and collect and enter data on the computer. They enter data on graphing calculators, complete scatter plot by hand with line of best fit, and discuss different graphing methods.
Curated OER
Economy of Ecology
Students work in groups to decide which statement best fits with each type of sustainable development from a handout about specific strategies countries are utilizing to promote sustainable development.
Curated OER
Shake It Up with Scatterplots
Students identify how to use a scatterplot to compare two sets of data to determine if they are related. Then they identify and describe the definition of regression line (the "line of best fit"). Students also identify how scientists...
Curated OER
Graphing and Analyzing
For this graphing and analyzing worksheet, 9th graders first state if each graph represents a linear or nonlinear relationship. Second, they create a difference table for each set of data presented and determine whether it represents a...
Curated OER
Linear Equation Experiments
In this linear equation instructional activity, students solve and complete 2 different experiments that include using linear equations. First, they determine the difference between independent and dependent variables. Then, students...
Curated OER
A Simple Thermoetric Titration
In this thermometric titration worksheet, students investigate the changes in temperature when an alkali is neutralized by an acid. Students graph their results from the titration and draw 2 best fit lines on their graph. Where the lines...
Pennsylvania Department of Education
Guess the Container
Young scholars become familiar with appropriate containers for various shapes. In this container instructional activity, students find containers that best fit their object.
Teach Engineering
Linear Regression of BMD Scanners
Objects may be more linear than they appear. Scholars investigate the relationship between the number of bone mineral density scanners in the US and time. Once they take the natural logarithm of the number of scanners, a linear...
Statistics Education Web
The United States of Obesity
Mississippi has both the highest obesity and poverty rate in the US. Does the rest of the data show a correlation between the poverty and obesity rate in a state? Learners tackle this question as they practice their skills of regression....
EngageNY
Using Linear Models in a Data Context
Practice using linear models to answer a question of interest. The 12th installment of a 16-part module combines many of the skills from previous lessons. It has scholars draw scatter plots and trend lines, develop linear models, and...
EngageNY
Analyzing Data Collected on Two Variables
Assign an interactive poster activity to assess your class's knowledge and skill concerning data analysis. The teacher reference provides solid questions to ask individuals or groups as they complete their posters.
Statistics Education Web
Text Messaging is Time Consuming! What Gives?
The more you text, the less you study. Have classes test this hypothesis or another question related to text messages. Using real data, learners use technology to create a scatter plot and calculate a regression line. They create a dot...
CK-12 Foundation
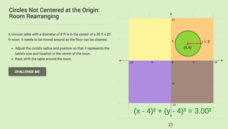
Circles Not Centered at the Origin: Room Rearranging
Where does a circular table fit best? Individuals move a circle representing a table into different quadrants of a room. Pupils determine which equation of the circle will place the table in the appropriate quadrant. A discussion...
American Statistical Association
EllipSeeIt: Visualizing Strength and Direction of Correlation
Seeing is believing. Given several bivariate data sets, learners make scatter plots using the online SeeIt program to visualize the correlation. To get a more complete picture of the topic, they research their own data set and perform an...
California Mathematics Project
Model Solar System
The sun's diameter is 864,337 miles—challenge learners to create a scale model of the solar system that fits in your classroom. Scholars make conversions and work with scientific notation as they create the scale model.
Radford University
A Day at the Beach!
Make math class feel like a day at the beach (minus all the sunburns, of course). Given information about a pail, a soup can, and a plastic pyramid mold, pupils calculate the volume of sand that can fit in each. They then design sand...
Curated OER
Fitting a Line to Data
Students work together in groups to collect data in relationship to how much water marbles can displace. After the experiment, they use the data to identify the linear equation to determine the best-fit line. They use the equation to...
Curated OER
Critical Stance Lesson 1: Which Style Fits?
Students analyze the elements of style for a work of art and compare it with the elements of style for a piece of writing. They read selections of the same story, and select the writing style that best fits the style of the painting,
Curated OER
Why Doesn't My New Shirt Fit?
Students test Leonardo da Vinci's view of the human body by measuring various body parts using a tape measure. They create a data table and a scatter plot and then analyze and interpret the results using a graphing calculator.
Prestwick House
Vocabulary Lesson
Vocabulary instruction works best when taught within a larger context. A vocabulary activity builds connections by using synonyms to help learn the meaning of new words. This helps connect the words to prior knowledge and give them context.
Curated OER
Fit Kid
Students practice and perform the song "Fit Kid" while learning the basics of motion and music and dynamics in this elementary-level instructional activity for the General Music classroom. The instructional activity emphasizes proper...
Curated OER
The Best Vacation Ever
Students research various vacation destinations and the costs of travel. For this vacation planning lesson, students obtain information for various purposes, research sites, document their findings, learn about geographical regions, and...
Curated OER
Absurdities: Nonsense Words Don't Fit
In this absurdities worksheet, students read 6 illustrated sentences and analyze the nonsense word in blue. Students replace the word with the best choice from 2 choices.


