Curated OER
It's a Party! Solving Multi-step Equations
Students explore the concept of multi-step equations. In the multi-step equation instructional activity, students solve equations by the 'party method'. Students make a flip book that shows the steps in solving multi-step equations.
Curated OER
Representing the Unknown
Student use mental math to solve linear equations. For this algebra lesson, students solve one and two steps equations. They write expressions using variables to identify the unknown.
Curated OER
Linear Inequalities
Ninth graders practice recognizing similarities and differences found in the graphing of inequalities and equations. Once observatioons are made they solve some of their own applying prior knowledge.
Curated OER
Review for the Algebra One SOLs
Students review the standards for Algebra I. Using the text, they discover two problems that match each standard and solve them showing all steps on paper. They create a PowerPoint slide for each problem and go through the correct...
EngageNY
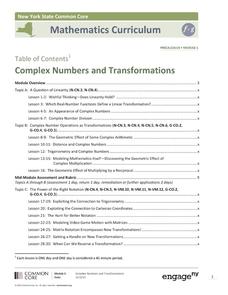
Complex Numbers and Transformations
Your learners combine their knowledge of real and imaginary numbers and matrices in an activity containing thirty lessons, two assessments (mid-module and end module), and their corresponding rubrics. Centered on complex numbers and...
Curated OER
Solving Systems of Equations by graphing for Algebra One
Students watch the teacher demonstrate on an overhead projector how to graph various equations before the students try them on their own. They start with pencil and paper; once they grasp the concept they move on to punching in the...
Curated OER
Equations of Lines Perpendicular and Parallel
In this algebra worksheet, students solve linear equations using one and two steps. They solve systems of equations using substitution and elimination with graphing. There are links for ready made tests and quizzes.
Curated OER
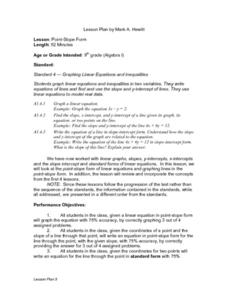
Point-Slope Form
Ninth graders explore the point-slope form of linear equations and graph lines in the point-slope form. After completing the point-slope equation, they identify the slope of a line through a particular point. Students explain the...
Curated OER
Every Graph Tells A Story
Seventh graders explore linear equations. In this graphing lesson, 7th graders explore constant rates of change. Students discover the real-life application of graphs and demonstrate their ability to read graphs and write corresponding...
Virginia Department of Education
Spring Fling Carnival
Think critically — and linearly by applying linear equations to solve real-world problems. Young mathematicians write equations to model the profit on popcorn and cotton candy at a carnival and solve problems using these equations.
Inside Mathematics
Squares and Circles
It's all about lines when going around. Pupils graph the relationship between the length of a side of a square and its perimeter. Class members explain the origin in context of the side length and perimeter. They compare the graph to the...
Curated OER
Introducing Linear Terminology
Ninth graders graph linear equations and inequalities in two variables and then, they write equations of lines and find and use the slope and y-intercept
of lines. They use linear equations to model real data and define to define the...
Curated OER
Earthquakes
Eighth graders demonstrate the mathematical components of a scientific problem as well as illustrate how real world problems can be solved using math. They demonstrate math skills such as rate calculation, graphing, and linear equations.
Curated OER
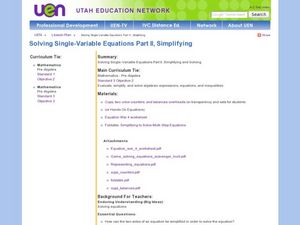
Solving Single-Variable Equations Part II, Simplifying
Seventh graders explore the concept of solving single-variable equations. In this solving single-variable equations lesson, 7th graders discuss how to simplify both sides of an equation. Students discuss using parenthesis and the...
Curated OER
Cockroach Slope
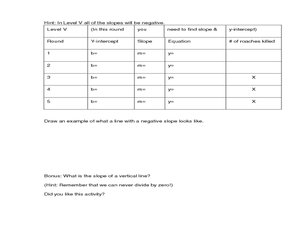
Students identify the slope of linear functions. In this slope lesson, students collect data and graph it. They write equations with no more than two variables and use technology to explain their data.
Curated OER
Two Variable Inequalities
In this algebra worksheet, students solve inequalities using addition, subtractions and multiplication. They graph the inequalities with shading. There are 2 questions.
Inside Mathematics
Sorting Functions
Graph A goes with equation C, but table B. The short assessment task requires class members to match graphs with their corresponding tables, equations, and verbalized rules. Pupils then provide explanations on the process they used to...
Curated OER
Solving Systems of Inequalities
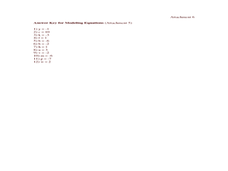
In this algebra worksheet, students solve systems of inequality using the graphing method. There are 5 questions with lots of examples and an answer key.
Curated OER
Algebra/Geometry Institute Summer 2009
Learners investigate linear equations through models. In this algebra lesson, students investigate solving one and two step equations. Review solving a basic equation before starting this assignment.
Mt. San Antonio Collage
Synthetic Division and Zeros of Polynomial Functions
More than just a worksheet, this guide provides the description of many of the polynomials theorems to assist the learners. Starting with synthetic division, class members are then guided through the remainder theorem and linear factors.
Curated OER
Mr. Payne Word Search Puzzle
In this language arts worksheet, students study 10 words in a word bank, then locate them in a word search puzzle. The words appear to be related to algebra; the meaning of the title is not known. There is one misspelled word in the word...
Inside Mathematics
Snakes
Get a line on the snakes. The assessment task requires the class to determine the species of unknown snakes based upon collected data. Individuals analyze two scatter plots and determine the most likely species for five additional data...
Inside Mathematics
Coffee
There are many ways to correlate coffee to life, but in this case a worksheet looks at the price of two different sizes of coffee. It requires interpreting a graph with two unknown variables, in this case the price, and solving for those...
Curated OER
Estimating the Mile Record
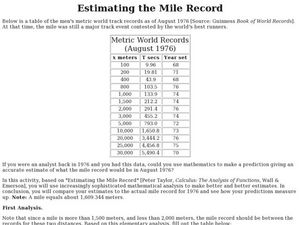
In this estimating the mile record, students examine given data. They use create a box-and-whisker plot to determine the upper and lower quartiles of the data. This one-page activity contains 1 multi-step problems.


