Curated OER
Systems of Equations 2
In this systems of equations worksheet, 9th graders solve and graph 9 different problems that apply the systems of equations. First, they solve each system of equations by using the graphing method. Then, students write the solution for...
Curated OER
Rescue Mission Game
Students conduct probability experiments. For this rescue mission lesson plan, sudents play a game and collect statistical data. They organize and interpret the data and determine the probability of success. Students plot points on a...
National Security Agency
What’s Your Coordinate?
Your middle schoolers will show what they know with their bodies when they become the coordinate plane in this conceptual development unit. Starting with the characteristics of the coordinate plane, learners develop their skills by...
Virginia Department of Education
Equations of Lines
Scholars connect slope-intercept form and standard form to the values of m and b by first matching a set of cards that have slope-intercept form, standard form, values of m, values of b, and graphs of linear equations. They then play a...
Illustrative Mathematics
Peaches and Plums
According to the resource graph, which costs more: peaches or plums? Algebra learners compare two proportional relationships and then throw in a banana. Leaving out the scale helps students become intuitive about graphing.
West Contra Costa Unified School District
Shifting Linear Equations in Function Notation
Time for a shift in thinking! Learners examine translations of linear functions. They use function notation to describe the translation and make connections to the graph.
West Contra Costa Unified School District
Sneaking Up on Slope
Pupils determine the pattern in collinear points in order to determine the next point in a sequence. Using the definition of slope, they practice using the slope formula, and finish the activity with three different ways to determine the...
Inside Mathematics
Coffee
There are many ways to correlate coffee to life, but in this case a worksheet looks at the price of two different sizes of coffee. It requires interpreting a graph with two unknown variables, in this case the price, and solving for those...
MARS, Shell Center, University of Nottingham
Defining Regions Using Inequalities
Your young graphers will collaboratively play their way to a better understanding of the solution set produced by the combining of inequalities. Cooperation and communication are emphasized by the teacher asking questions to guide the...
Curated OER
The Appearance of a Graph
Sixth graders understand that the appearance and increment used on the x and y axis in a graph change how it looks. In this graphing lesson, 6th graders work in pairs and interpret graphs using different axes. Students collect graphs...
Curated OER
Graphing Heart Rates
Students take their pulse rates. In this graphing lesson, students take their pulse rates and graph them. Students do various physical activities and graph the differences in their pulse rates.
Curated OER
Higher Order Thinking (H.O.T.) Lesson - BIG E
Fourth graders work with patterns while using large numbers. In this patterning lesson, 4th graders go over the definitions of the words: predict, estimate, attendance, increase, and decrease. They complete worksheets in which they track...
Curated OER
Graphing and the Coordinate Plane
Students examine the four quadrants of Cartesian coordinate plane. They play maze games and coordinate games to discover how to read and plot points on the plane. Students plot points on the coordinate plane and examine the ratio of...
Curated OER
Using Parallel Axes To Discover Mathematical Interconnections
For this math worksheet, students graph the functions on parallel axes and observe the location of the slope point in relation to the x and y axes.
Curated OER
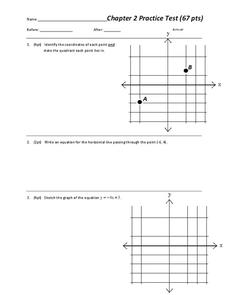
Chapter 2 Practice test
Overall, this worksheet contains a good selection of problems that reviews different aspects of linear equations. Learners examine and graph linear equations, absolute value equations, and inequalities in two variables. The three page...
Curated OER
Linear Equations
Middle and high schoolers complete problems with linear equations and then graph the lines they represent. They complete eight problems.
Curated OER
Graph Functions: Practice
In this graph functions worksheet, students complete several activities to help them graph functions. Students use the table and the graph to complete the questions. Students also answer two test prep questions.
Curated OER
Reading a Graph: Azimuth Range vs. Day in Barrow Alaska
Young scholars practice reading a graph while doing story problems. They determine the x and y intercepts and calculate the slope. They also practice writing linear equations.
Curated OER
Systems of Linear Inequalities
In this Algebra I/Algebra II worksheet, students solve systems of linear inequalities by graphing the inequalities on a coordinate plane and determining the location of all ordered pairs that solve the system. The three page worksheet...
Curated OER
Plotting Points
Eighth graders practice plotting points on a coordinate plane. As a class, they create and label the parts of a graph. Given ordered pairs, they plot the points, connect them to reveal a particular shape, and find the area of the shape.
Curated OER
The Coordinate Plane
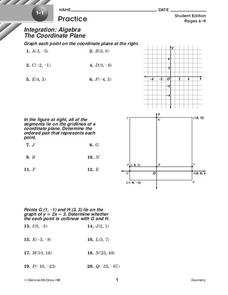
In this coordinate plane worksheet, 10th graders solve 20 various types of problems all related to identifying point on a coordinate plane. First, they graph each point on the coordinate plane at the top. Then, students determine the...
Curated OER
ALASKA-CANADA HIGHWAY PROBLEM
Students create a table of ordered pairs, using variables (dependent and independent), writing equations, converting metric and standard measurements for distance using mileposts.
Curated OER
Simplifying Expressions Using the Order of Operations
Students explore the concept of order of operations. In this order of operations lesson, students discuss the order of operations when simplifying expressions. Students discuss the importance of order in their lives such as getting...
Curated OER
Linear Relations
In this linear relations worksheet, students complete a table for given functions. They classify graphs as linear or non-linear. Students graph given equations. They compare and contrast graphs. This nine page worksheet contains five...
Other popular searches
- Graphing Ordered Pairs
- Graphing Coordinate Points
- Ordered Pair Graphing Paper
- Graphing Ordered Pair Ts


