Curated OER
Probability Popsicle Pop-ups
Fourth graders decorate and use popsicle sticks as manipulatives to assist with their learning of probability. They utilize a worksheet imbedded in this plan to organize the results of their experiment. They make a stem and leaf plot...
Curated OER
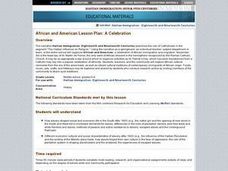
A Celebration
Students research the role of the Catholic church in the experiences of Haitian immigration. They organize a celebration of African and African-American cultures around the feast day of St. Martin de Porres, a saint of African descent.
Curated OER
Sculptured Landscapes
Students research glaciers, how they are formed and what kind of landforms they carve out of the rock they pass over. They organize their findings into a mock newscast in a presentation for the class.
Curated OER
What's My Job?
Young scholars watch an episode of the PBS show, "Maya & Miguel," and discuss various career options. They match pictures with job descriptions, organize a career day that includes local professionals and parents, and role-play...
Curated OER
Simple Keys and Nutrition
Third graders identify descriptive questions as a method for distinguishing objects and for identifying labels for objects and categorizing objects. They participate in a student grouping activity, then using pictures of different types...
Curated OER
Meet Our Class
Students survey the exploration of oneself through self-assessment and interviews by others. They organize ways to present themselves to the world through writing and artwork. They also customize research from a computer as a tool for...
Curated OER
Which Number Will Finish First?
Students conduct probability experiments. in this number lesson, students use spinners and conduct probability experiments. They collect and organize data on talley sheets.
Curated OER
Range, Mean, Median and Mode Through the Internet
Students compute measures of central tendency. In this range, mean, median and mode lesson, students gather information on the internet, organize the data and then compute the measures of central tendency. They create a persentation...
Curated OER
Video Communication
Students explore information and communication technologies. They plan, organize, produce, and edit a video to show to peers. They express themselves in an activity combining music and video shot from their own surroundings.
Curated OER
Writing Persuasive Letters
Students write persuasive business letters to candy companies suggesting ways to change their products to make them more enjoyable and increase sales. Prior to writing their letters, they conduct Internet research about the companies and...
Curated OER
Energy Content of Foods
Learners collect data, organize and analyze the data and compare it to real life scenarios. This assignment requires two class periods.
Texas Instruments
Math TODAY for TI-Navigator System - Is Leisure Time Really Shrinking?
High schoolers organize data from the USA TODAY Snapshot, "Is leisure time really shrinking?" into two scatter plots and determine the quadratic model for each scatter plot. They determine if these graphs intersect and learn the concept...
Curated OER
Alike or Different?
In this venn diagram worksheet, students write down facts about the United States and another country. Students organize their facts by comparing what is similar and different.
Curated OER
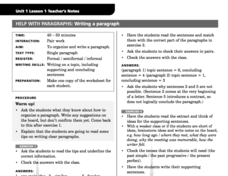
Help With Paragraphs: Writing A Paragraph
Young scholars complete exercises to practice writing a paragraph. For this paragraph writing lesson plan, young scholars work in pairs to complete activities that require them to read sample paragraphs, organize sentences in sequence,...
Curated OER
Data Handling
In this data handling worksheet, students interpret data found in table, graphs and charts. They organize data and draw bar charts. This two-page worksheet contains 2 multi-step problems.
Math Mammoth
Bar Graphs 1
In this bar graph activity, students organize data in a frequency table, then create a bar graph. They find the average of the data. This one-page activity contains two multi-step problems.
Curated OER
Story Elements Map
In this excellent story elements map worksheet, students view and discuss the advantages and disadvantages of using a graphic organizer to help structure stories and compositions. To my eye, this graphic organizer will help students...
Curated OER
Predictions - Graphic Organizer
In this interactive graphic organizer worksheet, students practice the steps involved in making correct predictions in a story. Students can use both an interactive graphic organizer and a hard copy of the graphic organize to guide their...
Curated OER
Multiplication Word Problems
For this worksheet learners will solve word problems that involve multiplication, addition and money using a table to organize the data. Students are then asked to determine which person in the problem made more money.
Curated OER
Inequalities and Measures of Central Tendency
In this inequality and measures of central tendency worksheet, students solve and graph linear inequalities. They organize given data to identify the mean, mode and range. Students interpret box-and-whisker plots. This three-page...
Curated OER
Problem-Solving Strategy: Use Logical Reasoning
In this logical reasoning worksheet, 4th graders read a paragraph about what three students are brought for lunch before determining what each student eats through logical reasoning. They record what they understand, make a plan, fill in...
Curated OER
Act it Out
In this money worksheet, learners solve 5 word problems where they are given an amount of money in written form and make a list to help organize the information in order to add the coin values. Students make change in 4 of the problems.
Curated OER
Use or Make a Table
In this use or make a table worksheet, students examine data given in a story problem. They use logic to determine the best way to begin organizing the data and creating a table. This one-page worksheet contains three problems. ...
Curated OER
Data! Data! Graph that Data!
Fifth graders create data graphs using Microsoft Excel. In this data collection lesson, 5th graders create and conduct a survey, then use Excel to organize and graph their data.
Other popular searches
- Graphic Organizers
- Biography Graphic Organizer
- Main Idea Graphic Organizers
- Vocabulary Graphic Organizer
- Story Map Graphic Organizer
- Organizer
- Science Graphic Organizers
- Setting Graphic Organizer
- Math Graphic Organizers
- 4 Square Graphic Organizer
- Sample Graphic Organizers
- Comic Book Graphic Organizer


