Curated OER
Fun With Graphs
First graders read about making graphs and lean how to make graphs using "The Graph Club" software.
Curated OER
Opening the Case
Students participate in a class survey and then design an experiment and use graphs and statistics to assist them in solving a problem. They organize the results of the survey in a stem-and-leaf plot and find the range, median, mean, and...
Curated OER
Enhancing Writing Through Technology
Students participate in a class survey of their favorite activity to do in the snow and organize the results in a graph. They write a paragraph about the graph using language from a class-developed word web and include both an opening...
Curated OER
Using Charts and Graphs to Study East Asia's Modern Economy
Students examine East Asia's modern economy. In groups, classmates use the internet to compare the resources, products, and economy of specified countries. After collecting the data, pupils create charts, tables and graphs. They...
Curated OER
Graphing Made Easy
Fourth graders discover the appropriate way to construct and analyze bar, line, picto, and circle graphs. They set up frequency tables and perform some statistical analysis (mean, median, and mode) on their data.
Curated OER
Exploring Function Graphs
Tenth graders investigate three different sets of data that relate temperature to another variable in the physical world. These illustrate linear, inverse and exponential relationships.
Curated OER
Aquatic Field Data
Students use laptops and sensors to measure water quality and graph their results. In this aquatics instructional activity students post their results to a website or email.
Curated OER
Graph Theory
Students explore the concept of graph theory. In this graph theory instructional activity, students participate in hands-on activities that enforce graph theory. Students manipulate graph applets on the internet. Students create a...
Curated OER
I'm in the Money - Practical Money Skills
Students make a budget and utilize math skills to keep a record of what they spend. They use technology and spreadsheets to help them keep track of their money.
Curated OER
Pancakes, Anyone?
First graders explore data collecting and graphing. In this data collecting and graping lesson, 1st graders watch a video about monster who sells pancakes. Students make a graph to record the most popular pancake. Students also play...
Curated OER
Eatem Up!
Students identify, interpret and demonstrate a positive learning attitude. They identify, comprehend and use basic concepts and skills and then, communicate clearly in oral, artistic, written, and nonverbal form. Students also identify...
Curated OER
Coin Count & Classification
Students make a prediction about how 100 pennies sort by decade or year and then test their predictions. They organize their data using a graph that is imbedded in this lesson.
Curated OER
One, Two, Three...and They're Off
Students make origami frogs to race. After the race they measure the distance raced, collect the data, enter it into a chart. They then find the mean, median, and mode of the data. Next, students enter this data into Excel at which time...
Curated OER
Environmental Issues in Multimedia Presentation
Students investigate a community environmental issue. They document it using traditional scientific methods, digital photography, and videotaping. After collecting data, they graph the results. Students present their findings in a...
Curated OER
Probability Popsicle Pop-ups
Fourth graders decorate and use popsicle sticks as manipulatives to assist with their learning of probability. They utilize a worksheet imbedded in this plan to organize the results of their experiment. They make a stem and leaf plot...
Curated OER
College Costs are on the Rise
Young scholars examine college costs in different states. In this college cost lesson, students create a table and determine the average cost of college for the states listed. They organize the data into measurement categories. Young...
Curated OER
Is Global Warming Happening?
Students investigate the probability of global warming and the effects of global warming on the environment. They conduct Internet research and collect data, transfer the data onto an Excel spreadsheet, and create a presentation that...
Curated OER
Respect for Self and Others-Giving and Getting the Big R
Seventh graders work in groups of three. They plan scenarios in which they demonstrate inappropriate and appropriate interpersonal skills in a variety of social situations. Students assume the roles of the individuals in their scenario...
Curated OER
The Five Senses
Study various objects and help kindergarteners use their five senses to classify the objects. They are presented with various objects and then use their five senses to sort and classify the objects. Then they use a Visual Ranking Tool to...
Curated OER
Plotting with Pennies
Fifth graders use pennies to gather data, organize and order data, graph the data on a stem-and-leaf plot, and evaluate the range, median, and mode of the data.
Curated OER
3-D Beginning Graphs
Students explore the concept of big and small. They collect objects from the classroom, sort them by size, and create a graph using Duplo stacking blocks.
Curated OER
Getting Ready for Success
Third graders review the poem and activity from the previous session and then work in groups of four to tape skill strips in the appropriate category on a Venn Diagram. Next, a spokesperson from each group gives a report summarizing...
Curated OER
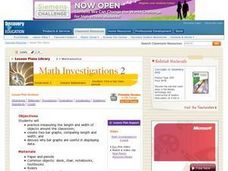
Math Investigations 2
Young mathematicians practice measuring and graphing skills while working in groups to measure objects found in the classroom. Using their measurements, they create one bar graph displaying the lengths and another displaying the widths.
Curated OER
My Four to Six Year Plan (My Personal Plan of Study)
Eighth graders examine what they need to do to meet their career goals. They design a four to six year plan for the classes they need to take in high school after listening to high school mentor tell about their experiences with this...


