Curated OER
A Closer Look: Unemployment
High schoolers view a video clip about unemployment. They research data and create a scatter plot graph. They discover the importance of graphs and what they can tell us. They create their own publication on unemployment.
Curated OER
Mean Meadian and Mode
Students apply central tendencies to given data. In this statistics lesson, students calculate the mean, median, and mode as it relates to their data. They collect data and graph it while identifying the way the numbers are ordered.
Curated OER
Creating an Enzyme-Substrate Model
Students explore the reaction rates of an enzyme-mediated reaction through experimentation. In small groups, they use everyday objects to demonstrate the effects of environmental variables on enzyme function.
Students graph and...
Mathematics TEKS Toolkit
Grade 6: Exploring c/d = pi
Introduce your math class to the perimeter of a circle. Teach them that pi describes the relationship between the circumference and the diameter. As a hands-on investigation, pairs or small groups use string to compare these two values...
Curated OER
Ready, Set, Go!
Middle schoolers predict if the height of a ramp affect how far an object travels. They design and conduct an experiment to test their predictions. The results are recorded and a graph is created to show the relationship between ramp...
Curated OER
Why Would I Owe My Soul to the Company Store?
Sixth graders listen to "Sixteen Tons" by Tennessee Ernie Ford and discuss what it means to owe one's soul to a store. In this mathematics lesson, 6th graders determine what a miner's income was minus his expenses graphing findings in a...
Curated OER
Let's Keep Track of Grades
Students participate in a technology project. This lesson is a hands-on spreadsheet project where students are responsible for keeping track of their grades for class. The students learn to enter data into a spreadsheet, create...
Curated OER
Yummy Apples!
Students discuss apples and how they are grown. They listen as the teacher reads "Apples," by Gail Gibbons. Students discuss the story. They view several different types of apples and compare their characteristics. Students taste several...
Curated OER
Pendulum Lab in 9th Grade Physical Science
Ninth graders conduct experiments to determine what affects the rate of a pendulum's swing. Working in small groups, they identify an independent variable to study and create an experiment to test their hypothesis. When tests are...
Curated OER
Rain On
Fourth graders study the water cycle and clouds. In this water cycle and cloud lesson, 4th graders determine the definition of condensation and watch a demonstration in which the teacher makes a cloud in a bottle. They discuss the water...
Curated OER
French Fry Fun: Estimating and Measuring
Third graders demonstrate their estimating and measuring abilities. In this length measurement lesson, 3rd graders produce estimates of how long a handful of French fries will be before physically measuring them. Students graph their...
Curated OER
Box-and-Whisker Plots
Eighth graders measure in feet and inches and convert to explore the relationship between the converted measurements. In this measurement lesson plan, 8th graders use the whisker and box plot to represent the measurement of a cat. ...
Curated OER
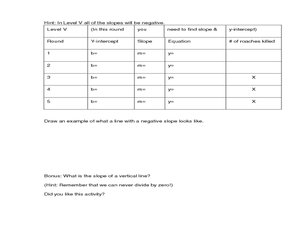
Cockroach Slope
Students identify the slope of linear functions. In this slope lesson, students collect data and graph it. They write equations with no more than two variables and use technology to explain their data.
Curated OER
Paint Property Experiments
Students identify various kinds of paints by using the scientific method. In this solvents lesson students collect data and identify paint samples while working in teams.
Curated OER
A Day to Remember!
Students study math. In this real-life problem solving lesson plan, students work on their skills dealing with time and money. They work in small groups on various time and money word problems and by the final day they have a final...
Curated OER
CSI Rhino
High schoolers study the rhinoceros and how the species has survived for so long. For this rhino lesson students create graphs and research what is being done to protect the rhino.
Curated OER
Water-The Liquid Gold
Learners investigate the necessity of water for the survival of plants, animals, and people. They explore the affect that water has on human and natural environments through literature, field trips, and discussions.
Curated OER
That's Entertainment
Second graders view examples of active lifestyles in works of Robert Harris, and list and graph their daily activities to see if they lead active lifestyles. Students then name forms of entertainment that require practice,...
Curated OER
State Database Lesson
Fifth graders create a database about the geography of the United States. The access to a computer is essential for this lesson. The outcome is that technology is used as a tool to measure student understanding of geographical locations....
Curated OER
Analyzing My Path to Success
Seventh graders review their graphs from the previous instructional activity about trends. Individually, they identify their personal strengths and weaknesses when it comes to being successful. To end the instructional activity, they use...
Curated OER
"Favorite Fairy Tale Characters"
Third graders enter the results of their survey on a spreadsheet. They construct a bar graph showing the results.
Curated OER
Gas Laws
Eighth graders use lab work and software to collect and analyze pressure and temperature data in order to illustrate the relationship between the temperature and pressure of a gas at a constant volume. They conduct a lab and organize...
Curated OER
Math and Cinderella
Pupils trace their feet and them compare the different sizes of classmates. They construct a bar graph showing the results of their classmates' feet size. They discuss what kinds of conclusions can be drawn from their observations.
Curated OER
How Low Can You Go?
Students are introduced to the concepts of elevation and slopes. Using Minneapolis and St. Paul, they graph elevation of various cities in a scenerio given to them. They also calculate the total miles traveled and organize the...


