Curated OER
The Demise of Copper's Trading Power
Eighth graders evaluate statistical equations. They examine data from archaeologists at Jamestown, complete statistical equations using the sets of data, and graph the results.
Curated OER
Home on the Biome
Fifth graders study six major biomes, graph temperature and rainfall, and present their findings to the class.
Curated OER
Technology Integration Lesson Plan: Music Database
Eighth graders gather information on fifteen of their favorite songs, create database with fields representing different attributes, explore and sort their databases, and create charts and graphs showing amount of play time vs. popularity.
Curated OER
Temperature and Altitude
Students, after reading the explanation given below, use FoilSim to gather and record data on temperature and altitude generated by the FoilSim control panel.
Curated OER
Box Plots on the TI-83 Calculator
Eighth graders research box plots on the Internet. They gather real life statistics and analyze the collected statistics by making multiple box plots on the TI-83 calculator.
Curated OER
Charting a New Course
Students calculate the distance they will travel. In this geometry lesson, students use the TI and CBL system to make calculation of a certain path. They explore geography by calculating distances between different areas as it relates to...
Curated OER
Box And Whiskers
Learners investigate the concept of using box and whisker plots. They demonstrate how to use them to compute median, mode, and range. Students compare and contrast the complete and systematic processes use to solve problems. This is done...
Curated OER
Inventors Unit Survey
Students develop and conduct a survey for their inventors unit. They create a five question survey and tally the survey results, and create a graph using Microsoft Word and Graph Club 2.0.
Curated OER
Weather for Health
Ninth graders encounter various types of numerical information (represented in multiple ways), much of which is abstract and difficult to comprehend. In this lesson, 9th graders will convert given information into bar graphs. In the...
Curated OER
And the Winner Is...
Third graders participate in an election project. They collect data to create a spreadsheet from which a graph is generated.
Curated OER
Plot! Analyze! Draw your Conclusions!
Students download data reported from the Global Sun Temperature Project website. They graph and analyze the data looking for trends and patterns. They prepare a class report with their observations and post it to the website.
Curated OER
Best Buy!!
Students use newspaper ads to determine the best buy on products. They enter the information into a spreadsheet and then use word processing software to complete a written analysis, complete with graphs.
Curated OER
Virtual Field Trip
Learners calculate gasoline cost per mile on a virtual field trip. They calculate the gasoline costs and travel time for each of the 2 routes, and record on a data sheet. They use Excel to create data tables for mileage, gasoline...
Curated OER
Statistical Sampling
Students collect data in the field and analyze it in class using tables and graphs to determine how many observations of a phenomenon are necessary to draw valid conclusions.
Curated OER
Different Perspectives of Oregon's Forest Economic Geography
Students locate the many forests located in Oregon. In groups, they use the internet to research employment data on wood products made in the state. They discuss how looking at information presented in a different way can change their...
Curated OER
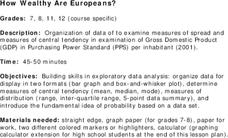
How Wealthy Are Europeans?
Students investigate measures of central tendency. They examine compiled data and conduct critical analysis. The graph is focusing on the gross domestic product data. The lesson also reviews the concept of putting values in order of...
Curated OER
Flying High in Math
Seventh graders study how real airplanes fly and then they construct models of paper airplanes using design resources for the Internet and their own design. They use meaurement and caluculations in order to help them construct their...
Curated OER
Out of Sight, Out of Mind
Students analyze and graph the waste created in a typical lunch period. They increase awareness of various types of garbage students create during a lunch period. They construct and label a graph of lunch waste. They brainstorm...
Curated OER
Valentine Hearts
Students sort candy Valentine hearts into groups and create individual graphs.
Curated OER
Parts of a Whole
Fourth graders explore fractions through the analysis of various paintings. They view and discuss paintings by Picasso and Seurat, discuss the fractional examples in the paintings, and create a bar graph.
Curated OER
What is a Cloud
Third graders study clouds and how they are formed. They write acrostic poems about clouds and analyze and graph temperature data collected during varying degrees of cloud cover.
Curated OER
Watersheds:Stream Channels And Post-fire Stream Flows
Students draw cross sections of a stream channel from field data. In the field, using a GPS, they determine the depth of a stream channel and use a spreadsheet to graph the stream channel.
Curated OER
Scientific Inquiry: Periodic Motion
Students construct their own pendulum. In this physics activity, students design an experiment to find the factors affecting its period. They formulate a conclusion based on experimental data.
Curated OER
Penguin Heights
Young scholars use the worksheet from the first website listed below to collect data on the penguin heights on the Penguin Page.


