Curated OER
Keypals and You
Students collect and compare data received from keypals. They use electronic mail to exchange information with keypals and rrite a paper comparing similarities and differences between themselves and their keypals. In addition, use a...
Curated OER
It Takes All Kinds!
Students view video clips and observe similarities and differences between animals. They sort animals into groups for a zoo. They make a graph of their observations and review scientific classifications.
Curated OER
Math Can Be Mean!
Fifth graders are introduced to the topic of means. Calculating the mean, mode and median, they describe what each set of numbers tell and do not tell about the data. They use a line graph to practice finding the mean. They also use...
Curated OER
How Much Do We SPend For Electricity?
Students investigate the concept of energy and focus upon the usage and the cost associated with it. They conduct research using a variety of resources while working in cooperative groups. Students graph the usage of energy as estimates...
Curated OER
Late Bloomers
Students demonstrate an understanding that individuals grow at various rates. In this health lesson, students read Leo, the Late Bloomer and identify ways to be tolerant of others. Students record the height of classmates and graph the...
Curated OER
Mother May I?
Third graders measure distance using nonstandard units of measure. In this measurement lesson, 3rd graders measure a given distance through the use of the game "Mother May I?" Student gather and compare data on how many "giant steps" and...
Curated OER
Cancer Warrior
Students perform an experiment to determine how different salt concentrations affect the liver's ability to break down toxic hydrogen peroxide. They record and average their data which is then graphed.
Curated OER
Sales Leader
Young scholars examine a set of data based on a realtor's sales for a specific amount of time. Using this information, they calculate the mean, mode and median and how to skew the data to different points of view. They determine which...
Curated OER
A Canadian Inventory: The Way We Are!
Students use the Canadian Atlas to discover an inventory of Canada's wealth and usage of resources. Using charts and graphs, they produce a wall of selected data of importance to the country and identify one issue of sustainability. ...
Curated OER
Social Studies: Canadian City Comparison
Students research Canadian population distribution while comparing and contrasting the quality of life in two cities. They discuss issues and problems that cities and rural towns face. Students apply various methods, such as graphs and...
Curated OER
Rodeo Round-Up
First graders create a graph of the various teachers' favorite events at the rodeo.
Curated OER
Mapping My Community
Ninth graders are introduced to GPS technology. They complete fieldwork as they visit a specific area of their community to identify and map types of land use in the surveyed area. They use the collected data to create a digital map.
Curated OER
Effect of Daylight Hours on Human Activity
Students determine the average hours of daily sunlight for each month of the year by constructing a bar graph. They develop a understanding of how the amount of daylight hours varies by month and how that affects both temperature and...
Curated OER
Volatile Volcanoes
Students have fun with graphics, graphs and money, simultaneously learning with up-to-the-minute information.
Curated OER
Rolling Dice
Fourth graders investigate the mathematical concept of probability. They determine the given mean of a data set found when rolling dice. The results of the experiment are displayed using a bar graph. The teacher does an example before...
Curated OER
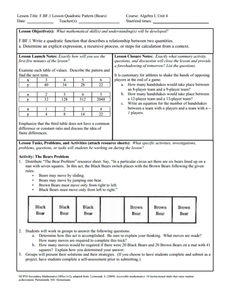
Bears
Young scholars complete a variety of bear-related activities. They sort and graph teddy bears, distinguish between real and non-real bears and research bear life cycles and habitats.
Curated OER
What are Quarters Made of?
Learners study the meaning, symbolism, and value of U.S. coins,
especially the quarter. They l research why in 1965 the U.S. Mint decided to
change the metal composition of the quarter to copper coated with zinc. In addition, they...
Curated OER
Sink or Float?
Students predict and explore to discover which objects sink or float in fresh and salt water, predict how salt affect objects, write predictions on T chart, discuss difference between man-made and natural waters, and graph results.
Curated OER
Strange Encounters
Third graders examine a variety of Robert Harris' paintings. Using the characters in the art, they develop a conversation between them in a musical verse. In groups, they identify safety procedures to be used by those traveling in the...
Curated OER
Shake, Rattle, and Roll
Students make an earthquake simulator and test their structure to see if it lasts through the earthquake. In this earthquake lesson plan, students make a structure and test and record the results from an earthquake simulator made out of...
Curated OER
Uniform Motion
Students identify when uniform motion occurs. They watch a teacher made PowerPoint explaining the concept of uniform motion and carry out an experiment to understand the concept.
Curated OER
BEETLES: The Coming Out
Young scholars design an experiment to test the variables involved in the hatching of the Bruchid beetle.
Curated OER
Schoolyard Bird Project
Students observe and count bird sightings around their schoolyard throughout the school year.
Curated OER
Telling Time to 5 Minutes
In this second grade lesson your class will practice telling time. The goal is to tell time to five minutes using an analog clock. Your young students count by 5 minute intervals and discuss elapsed time.


