CK-12 Foundation
Ck 12: Statistics: Basic Graph Types
[Free Registration/Login may be required to access all resource tools.] Organize distributions of data by using a number of different methods.
Oswego City School District
Regents Exam Prep Center: Displaying Data
Use this lesson, practice exercise, and teacher resource in planning instruction on displaying data. In the lessons, you'll find definitions and examples of ways to collect and organize data, quartiles, and box-and-whisker plots, as well...
E-learning for Kids
E Learning for Kids: Music: Presenting Data
Can you help Grace organize a dance show for her school?
Scholastic
Scholastic: Cultivating Data
Students will understand key concepts of data analysis and their graphic representations. Students will construct and interpret data tables, line plots, box-and-whisker plots and stem-and-leaf plots, scatterplots with line of best fit,...
Better Lesson
Better Lesson: Fast Food Freddie Surveys and Bar Graphs
Students continue to build their graphing skills. They experience a real world application of graphing by organizing survey results.
Better Lesson
Better Lesson: Graphing Data on a Graph
Second graders will be able to read and write data on a graph.
Scholastic
Scholastic: Study Jams! Math: Data Analysis: Bar Graphs
Watch a short animated video explaining how to set up a bar graph to graph information. Then test yourself to check for understanding.
E-learning for Kids
E Learning for Kids: Math: Rice Field: Data and Length
On this interactive website students practice various math skills using a real life scenario of a rice field. Those skills include understanding information displayed in column graphs, collecting data to answer a question, and measuring...
Better Lesson
Better Lesson: Graphing Our Snack Mix: Review of Graphing
Second graders review how to make bar graphs, line plots, and pictographs by tallying the contents of snack mix and building graphs to show their data.
Cyberbee
Adventures of Cyberbee: Graphing
Teacher-directed lesson plan focusing on data analysis, graphing, and probability. Lesson includes a video and engaging spreadsheet activities.
US Department of Education
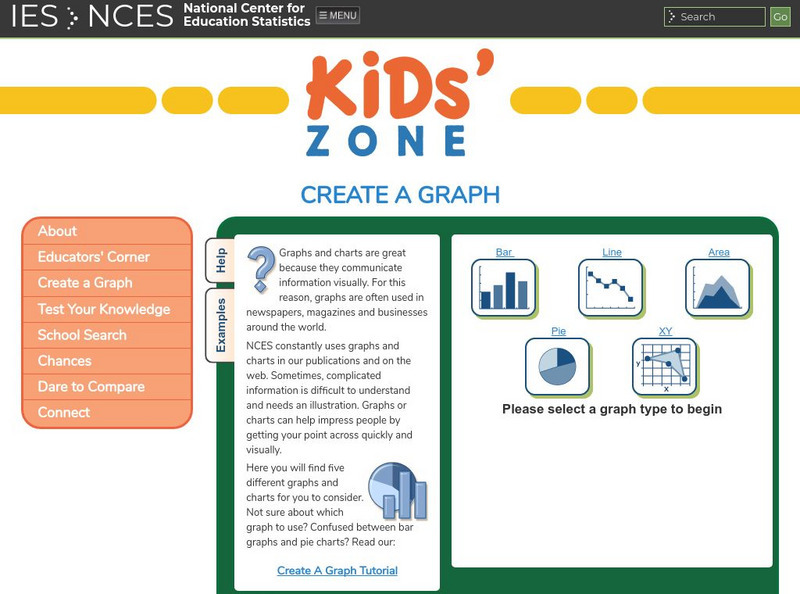
Nces Kids: Create an Xy Graph
This is where you can find a step by step explanation of how to create an XY graph. When you finish each step just click the next tab and you will find the next set of instructions.
Oswego City School District
Regents Exam Prep Center: Categorizing Data
Three lessons on different types of data (qualitative, quantitative, univariate, bivariate, biased data) as well as a practice activity and teacher resource.
University of Texas
Inside Mathematics: Granny's Balloon Trip [Pdf]
This task challenges a student to use knowledge of scale to organize and represent data from a table on a graph.
US Department of Education
National Center for Education Statistics: Create a Graph Tutorial
This tutorial walks students through how to create different types of graphs using the Create a Graph tool available on the website. Covers bar graphs, line graphs, pie charts, area graphs, scatter plots, and dependent and independent...
Texas Education Agency
Texas Gateway: Data Organization
Given field and laboratory scenarios and laboratory data, students will construct data tables and graphs, using repeated trials and means to organize data.
Other
Brebeuf Jesuit Preparatory School: The Scientific Method (Part 3) [Pdf]
Explains how to collect and organize data for an experiment. Describes how to make a table and graph the data, and when to use different types of graphs. Next, it discusses which variable should be on the x- or y-axis of a graph, and how...


