Curated OER
Jellybean Graphs
Second graders predict and graph data based on the color of jelly beans they think are in a handful. In this prediction lesson plan, 2nd graders will predict how many of each color jellybean are in a handful. Then they graph these...
Curated OER
Statistical Pictures of School and Life
Students explore how mathematical data is used to summarize and illustrate everyday life. They apply mathematical concepts and skills to analyze data. Students conduct a five question survey of 50 people or more and graph the data.
Curated OER
Graphing Activity
In this probability and statistics worksheet, students work with a family member to construct graphs based on real life data. The two page worksheet contains three questions. Answers are not included.
Curated OER
Bluebirds Project
In this bluebirds project worksheet, students are given directions on completing a project about bluebirds including measurements, scientific method questions, data entry, and more. Students complete 15 exercises.
Curated OER
Unit 2: Lesson 8
Students login to their account and access information from keypals. They compare their data with information recieved by classmates. Students review question that were asked of keypals. They discuss ways that expected data can be...
Curated OER
Background of Diseases-- Germs or Genes?
Students explore the background of common diseases. In this personal health lesson, students research causative agents of communicable and non-communicable diseases. Students use their research findings to create data tables in Microsoft...
Curated OER
Graphing with Stems-and -Leafs
Fourth graders examine the use of stem and leaf graphs. For this stem and leaf graph lesson, 4th graders participate in teacher led lesson showing the use of the graphs. They work in groups to collect data about peanuts before making a...
Curated OER
What is the Best Chip?
Scholars collect data about chips. They pick their favorite type of chip from a given variety such as potato chips, tortilla, or banana chips. Then they write on an index card their favorite chip and why it's their favorite. They also...
Curated OER
Organizing and Understanding, Step-by-Step
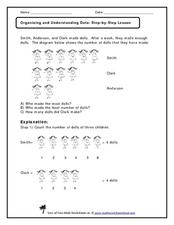
Use this number comparison and counting worksheet as an overhead projection for the whole class, because the answer is explained on the bottom half of the sheet. Cover the answer and reveal it once learners have tried it themselves. They...
Balanced Assessment
The Triskaidecaphobia Conference
Triskaidecaphobia is an extreme superstition to the number 13—and ironically the answer to the word problem is 13! Presented with a series of descriptive data, individuals analyze the data to determine the population size. They must...
Virginia Department of Education
Organizing Topic: Probability
The probability is high learning will occur! A well-designed unit introduces learners to the concepts of independent, dependent, and mutually exclusive events. Using Venn diagrams, the lessons ask learners to analyze many different...
Curated OER
Finding My Pathway
Eighth graders engage in a lesson that is concerned with the acquiring of skills necessary to make informed career choices. They examine the type of language that should be acquired for communication in the workplace. They also have...
Curated OER
Hopes and Dreams: A Spreadsheet Lesson Using Excel
Fourth graders read "The Far Away Drawer" by Harriet Diller and discuss the story as a class. After discussion, 4th graders create a t-shirt GLYPH about their hopes and dreams,share their information with the class and create spreadsheets.
Curated OER
Mythology Spreadsheet
Students read a large variety of myths and discuss the characters and their attributes found in mythology. Then they identify and learn to set up an appropriate spreadsheet program. Students also enter the data to the class spreadsheet...
Curated OER
Quick Questions: Open-Ended
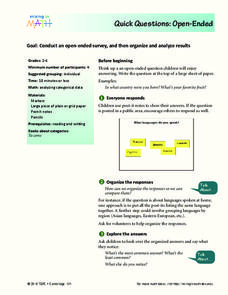
Pupils conduct an open ended survey and analyze the data they found. In this open-ended survey lesson plan, students ask others their open ended questions and then organize their results based on the most common, least common, and every...
Curated OER
Combinations and Permutations
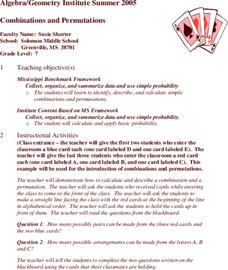
Fifth graders investigate the concepts of combinations and permutations using probability. They practice calculations using probability to measure the outcomes. Students demonstrate how to organize and categorize the data.
Curated OER
Acid-Base Titration
Students determine the concentration of an unknown solution. This task assesses students' abilities to state hypothesis, develop procedures for investigation, plan for recording and organizing observations and data, collect data, create...
Curated OER
Gee, It's Crowded in Here
Students interpret raw data about population statistics. In this raw data lesson plan, students plug the data into graphic organizers and draw conclusions based on their findings.
Curated OER
Misleading Graphs
Students explore number relationships by participating in a data collection activity. In this statistics instructional activity, students participate in a role-play activitiy in which they own a scrap material storefront that must...
Curated OER
Mapping River Statistics
Students research different statistics to do with the Mississippi River. They answer questions about finding data and collect it by conducting research. The research is used to construct a data table. Then students use the table to...
Curated OER
Stemmin'-n-Leafin'
Learners make stem and leaf charts to determine the measures of central tendency using test score data. They analyze the data to draw inferences which they share with the class. They complete the associated worksheets.
Curated OER
Getting A Grip On Graphs
Fourth graders investigate the concept of graphing and comparing different types of data using pictographs, line graphs, scatter plots, etc... They gather data and make interpretations while examining the medium of how it is displayed.
Curated OER
Probability Lesson Plan
Your learners will examine probability through experiments and dice games. Using a computer, your class will perform simple experiments to collect and analyze data to determine the probability of different experimental results. Young...
Curated OER
What is a Box and Whisker Plot?
Eighth graders explore the correct use of box and whisker plors. The times when they are appropriate to use to compare data is covered. They plot data according to statistical analysis including mean, median, and mode.


