Curated OER
Making and Using a Graphic Organizer for Solving a Mystery
Students create tables in a word processing program which helps them organize their text clues when reading a mystery story. They develop reading comprehension strategies while using a computer based graphic organizer in order to solve...
Curated OER
Fresh Water and land of Kiribati and Hawaii (Molokai)
Fourth graders examine the islands of Hawaii. Using this information, they organize it and create a map or graph that represents the data. As a class, they discuss how the watersheds on the islands are different and how people react to...
Curated OER
Investigation-How Many Toothpicks?
Seventh graders use toothpicks to investigate a series of designs and identify patterns. Data is organized and analyzed using tables and graphs, and students make generalizations using algebraic expressions.
Illustrative Mathematics
Puppy Weights
Nobody can say no to puppies, so lets use them in math! Your learners will take puppy birth weights and organize them into different graphs. They can do a variety of different graphs and detail into the problem based on your classroom...
Curated OER
What Pie?
Students practice making and interpreting pie graphs so they are better able to decide if a pie chart is the appropriate form of display. Students examine included overheads of different pie charts, and directions on how to make pie...
Curated OER
??Data Gathering in the Field??
High schoolers demonstrate that they understand basic operations and concpets, students further use technology to enhance learning, increase productivity and and promote their creativity. High schoolers gain an understanding of the...
Curated OER
Gravity Versus the Mighty Egg
Students design, revise and construct a method for protecting an egg from cracking when it is dropped from a height. They work in small groups to develop their protection method and then collect and analyze data as a class when each...
Curated OER
Great Tasting Shapes
Fifth graders investigate the concept of median, mode, and range using a simple model for display purposes. They examine different shaped crackers out of a box and identify the ones that occur the most. Then the calculations for the...
Curated OER
Algebra- Cell Phone Plans
High schoolers analyze graphs to compare cell phone plans. In this algebra lesson, students work together to analyze phone plans and report the best phone plan. High schoolers develop tables and graphs.
Curated OER
Rain Forests: A Disappearing Act?
Students examine and locate rainforests on maps, and research the patterns of their destruction. They develop a bar graph of rainfall and temperature data, write a journal entry, and research the people, animals, and plants/products of...
Curated OER
The Importance of Imports
Learners explore world trade by examining items they find at home and listing countries those items came from. Data is displayed on a map and charted according to continent. They discuss how products are transported.
Curated OER
Problem Solving and the Sports Page
The use of box scores from baseball games is the foundation of this math lesson. Organize your class into groups of four, and give identical box scores from a baseball game that was just played. Have them create word problems from the...
Curated OER
Water Monitoring and Pollution
Students explore the effects of pollution on water supply and how to identify safe drinking water. They test different samples of water over regular intervals and analyze the results to see if they are cyclical or represent a growing...
Curated OER
The Working of Scientists
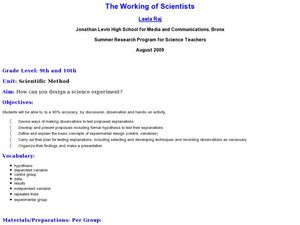
Students define and explain the basic concepts of experimental design. In this scientific method instructional activity students complete a hands on activity, develop and present proposals to test their explanations.
Curated OER
The Beat of Your Heart
Students explore different applications involving their own heart. In this illumination instructional activity students measure their fists and relate it to the dimensions of their hearts.
Curated OER
Who Done It?
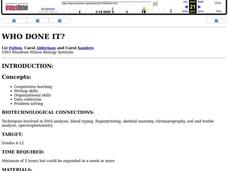
Students work in groups to solve various murder mysteries using DNA evidence to implicate suspects. Teams compete to solve the crimes the fastest, while using various scientific methods to accomplish their task.
Curated OER
Skittle Graphing (Lesson Plan)
Students discuss the uses of graphs. They use color candies to count and sort before designing graphs. They label the graph papers with appropriate titles and candy colors. They complete the graph bars, and discuss the results with a...
Curated OER
Pictograph to Bar Graph
Second graders explore organizing data to make it useful for interpreting picture graphs and bar graphs. They use Graphers software to create a pictograph and a bar graph.
Curated OER
Life in Streams and Ponds
Students collect microorganisms, demonstrate correct laboratory/Gram stain procedure, and design and construct tables to organize data.
Curated OER
Watch Over Wild Wanders
Students collect and organize data relating to migratory species and habitats; undertake a habitat action plan, then maintain planting and building projects for continuing benefit to wildlife; understand the unique needs of migratory...
Curated OER
Career Connections
Students research information to create a career projects where technological skills will be utilized. In this career projects lesson, students create a project relating to a selected career of personal interest.
Curated OER
Closing the Case
Fifth graders collect data and prepare data displays using a survey with statistical information.
Curated OER
Number and Operation: All About Monday - Does it Pay?
Solve real-world financial math problems. High schoolers will work through a series of problems as they look at credit card interest, bill payment, and other real-world personal money matters.


