Kenan Fellows
Using Water Chemistry as an Indicator of Stream Health
Will this water source support life? Small groups test the chemistry of the water drawn from two different sources. They then compare the collected data to acceptable levels to draw conclusions about the health of the source. The...
Curated OER
Oh, What A Day
Students listen as the teacher reads A Country Far Away. They predict what they will do and what they think their partner student will be doing. Students create a KWL chart for Japan. They collect information about their activities on an...
Curated OER
Exploration of "Pillbugs"
Fifth graders define vocabulary terms, identify the characteristics of a pillbug, and create a dichotomous key. Then they examine the pillbugs and make observations and record these observations. Finally, 5th graders observe specific...
Missouri Department of Elementary
The Successful Student: Let’s Review for Better Achievement
Study skills, time management skills, and test taking-skills are important attributes for both the classroom and the real world. Focus on these learning skills in a lesson that reviews how to be a good student and make better grades.
Curated OER
The Good and Bad Bacteria
Students are able to name one kind of harmful bacteria and why it hurts us and also name one kind of helpful bacteria and how we use it. They describe the process of growing bacterial cultures in a lab. Students create a reasonable...
Missouri Department of Elementary
Life … Bring It On!
To conclude the study of coping skills, class members create a collage that identifies and celebrates their strengths that support their ability to make good decisions.
Curated OER
The Game is Afoot - A Study of Sherlock Holmes
Mystery is an exciting genre for young readers to investigate. The plots are so intriguing! Here is a series of lessons featuring Sherlock Holmes stories that invite learners to enter the world of the mystery genre. Based on what they...
National Geographic
Australia, Antarctica, and Oceana
Go on a traveling adventure throughout Australia, Oceana, and Antarctica! This textbook excerpt offers a full unit of study that can easily be supplemented by extra projects or research materials. Learners study maps, read about native...
Curated OER
African American Women Before and After the Civil War: Slavery and Freedom
Students listen to data on African American women in Texas before the Civil War. In this Civil War lesson, students compare and contrast the lives of slave and free women, and discuss case studies, locating areas on a map. Students...
Curated OER
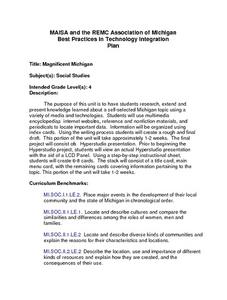
Magnificent Michigan
Fourth graders complete a research project about the state of Michigan. They conduct Internet research, organize the information on index cards, and create a HyperStudio presentation.
Curriculum Corner
Assignment Checkoff Sheet
Straightforward and simple, this checkoff sheet is a great addition to your classroom toolbox. It has space for 21 names on the left side, and 10 categories on the top of the page.
Teaching Tolerance
Changing Demographics: What Can We Do to Promote Respect?
America has always been seen as a melting pot to the world. Scholars research the concept of blending cultures in the United States and how it is changing over time. The final lesson of a four-part series analyzes the changing...
101 Questions
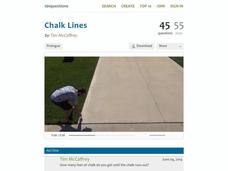
Chalk Lines
Read between the lines to find a solution. Budding mathematicians analyze a situation to solve a problem. They view a video presentation of the problem, brainstorm important information to gather, and write linear equations to find...
Curated OER
Real Estate Lesson: Monthly Payments
Pupils examine real-world data relating to real estate. They conduct Internet research, record data regarding real estate in major cities, graph the data, calculate mortgage payments using a mortgage calculator, and analyze the data.
Curated OER
Education for Global Peace
Fifth graders construct data graphs based upon sets of data. In this graphing instructional activity, 5th graders read the text If the World Were a Village and discuss how types of graphs accurately represent a large population. Students...
Curated OER
And the Survey Says...
Learners use technology to input, retrieve, organize, manipulate, evaluate, and communicate information; apply appropriate technologies to critical thinking, creative expression, and decision-making skills. They collect and explore data...
Curated OER
Mystery Graphs
Pupils study graphs and learn how to display information into a graph. In this graph lesson plan, students construct a graph of their own sorted data, and pick out things in graphs that are inconsistent.
Curated OER
Mountain of Ice
Students graph and analyze chemical concentrations from ice core data. In small groups they prepare their graphs using colored pencils, and discuss the results.
Curated OER
Science and Technology
Students research inventions that have been created. In this historical technology lesson, students read the Harcourt Brace social studies textbook and discuss how inventors used graphs to display data. Students create a table to write...
Curated OER
Midterm 1 Exam: Statistics
In this statistics worksheet, students determine the mean, variance, standard deviation and median of given statistical data. They organize data, create box-and-whisker plots and identify outliers. This nine-page worksheet contains 7...
Curated OER
Halloween Graph Paper
In this Halloween graphing worksheet, 5th graders enhance their math skills by using the graph to help them collect and organize data.
Curated OER
They Don't Just Eat Grass
Middle schoolers explore and examine different types of feed used for livestock. They discuss types of feed, the need for energy and health, and create graphs of food compared to categories. Students organize data and complete worksheets...
Curated OER
Variation
In this variation worksheet, students interpret and organize data. They find the distance between points. Students use ratios to determine volume This six-page worksheet contains approximately 20 problems. Answers are provided on the...
Curated OER
Sorting Sweethearts
Young scholars categorize sweetheart candy by color or message. In this sorting and graphing instructional activity, students collect data by sorting the candy and then diagram their results in a graph.


