Curated OER
How Does Your Population Grown?
Do you know how the population has grown of your community? Can you predict the population over the next half century? Can we find an algebraic model that matches our data? These along with many more questions can be researched by...
Curated OER
California Missions
Fourth graders use what they already have gathered on California missions to create a database. Using the different missions, they brainstorm, organize and categorize what they have gathered. They present their material to the class and...
Curated OER
The Hot Dog Stand
Students run a computer simulation. They collect data as they work and use the data to create an annual report for their business. Several different simulations could be used for this project. It is desirable for students to do this...
Curated OER
Pick a Pet
Students design informational materials to educate people on the importance of matching a new pet to the family's lifestyle and living arrangements. Students use critical thinking skills to make a decision on the appropriate choice for a...
Curated OER
Height versus Shoe Size
Students find a correlation between a person's height and his/her shoe size. They have access to entering data into lists on a graphing calculator and can complete scatter plots. Students read and interpret a scatter plot and use the...
Curated OER
How's The Weather?
Students make a box and whiskers plot using the TI-73 graphing calculator. Each student would have their own calculator but they would work in small groups of two or three to help each other enter the data and make the plots.
Curated OER
Plant Diversity and Distribution
Learners construct a defined plot on school grounds and observed patterns in plant life. They count trees, shrubs, cacti and record on a data sheet. They compare data and generate a plant diversity overlook for their school.
Florida Center for Instructional Technology
Integrating Mathematics into Literature
You class will read Cucumber Soup by Vickie Leigh Krudwig as an anticipatory set for this instructional activity on ratios. They make models of the insects in the story and then use them as a source of data for this ratio and proportion...
Curated OER
Graphing Pendulum Results
Sixth graders set up a pendulum experiment deciding which variable to manipulate (length of string or weight on the string). They create a hypothesis, collect necessary equipment, and write out each step of their experiment. They then...
Curated OER
Scattered About
Students are introduced to the concept of scatter plots after reviewing the various types of graphs. In groups, they analyze the type of information one can receive from a scatter plot and identify the relationship between the x and y...
Curated OER
Shoe Showdown
Third graders use rulers to measure their shoe size in inches and centimeters. They then enter the class shoe measurements into an excel data base and graph the results of both to make the comparison.
Curated OER
Old Glory
Learners utilize mathematical concepts such as: measurement, ratio and proportion and geometric probability to analyze the components of the U.S. Flag. They collect, organize and interpret data by constructing charts, tables and graphs...
Curated OER
Discovering Dinosaurs
Third graders use an online database to gather information about five dinosaurs that are of interest to them. Using a chart, they record their length, height and two interesting facts for each dinosaur. They draw a picture of the...
Curated OER
Probability and Applications of Simulations
Middle schoolers apply properties of probability to the real world. In this probability lesson plan, learners simulate the construction of empirical distribution. They collect and analyze data using central tendencies.
Curated OER
Alfalfa Butterfly/Caterpillar Lifecycle Investigation
Young scholars collect and record data. They identify sex of butterflies. They make conclusions based on collected data.
Curated OER
Nature and Fitness Trail
Students plan stations for a nature and fitness trail and construct an accompanying e-Book for extended descriptions at each station. Data on the human impact on the environment is gathered in this activity.
Curated OER
Getting Into Shapes: Identifying and Describing Two-Dimensional Shapes
Young scholars examine their classroom to find examples of various types of shapes. After identifying and describing the various shapes, they draw as many as they can on a piece of paper. They organize them into an image based on their...
Curated OER
Team Apollo
Seventh graders brainstorm about problems with a school track. They research different possibilities for a solution. They test different track materials with erosion, durability, abrasiveness and resiliency. They determine the area,...
Curated OER
Making and Using a Graphic Organizer for Solving a Mystery
Students create tables in a word processing program which helps them organize their text clues when reading a mystery story. They develop reading comprehension strategies while using a computer based graphic organizer in order to solve...
Curated OER
Fresh Water and land of Kiribati and Hawaii (Molokai)
Fourth graders examine the islands of Hawaii. Using this information, they organize it and create a map or graph that represents the data. As a class, they discuss how the watersheds on the islands are different and how people react to...
Curated OER
Investigation-How Many Toothpicks?
Seventh graders use toothpicks to investigate a series of designs and identify patterns. Data is organized and analyzed using tables and graphs, and students make generalizations using algebraic expressions.
Illustrative Mathematics
Puppy Weights
Nobody can say no to puppies, so lets use them in math! Your learners will take puppy birth weights and organize them into different graphs. They can do a variety of different graphs and detail into the problem based on your classroom...
Curated OER
What Pie?
Students practice making and interpreting pie graphs so they are better able to decide if a pie chart is the appropriate form of display. Students examine included overheads of different pie charts, and directions on how to make pie...
Curated OER
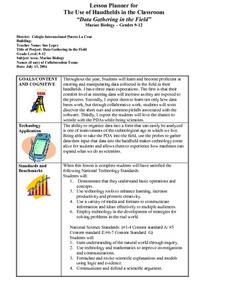
??Data Gathering in the Field??
High schoolers demonstrate that they understand basic operations and concpets, students further use technology to enhance learning, increase productivity and and promote their creativity. High schoolers gain an understanding of the...


