Missouri Department of Elementary
To Give In or Not to Give In—That Is the Question!
No! A very simple word that can be very hard to say. Seventh graders have an opportunity to practice this difficult skill as they engage in a series of role-playing scenarios. As an exit ticket, 7th graders write a reflection on the...
EngageNY
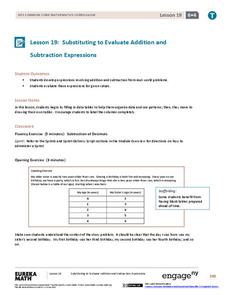
Substituting to Evaluate Addition and Subtraction Expressions
Substitute this resource for what you used to use. Learners identify patterns in data tables and write addition and subtraction expressions to represent relationships. Substitution allows them to solve problems in context in the 20th...
Missouri Department of Elementary
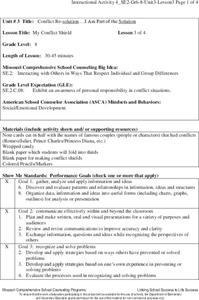
My Conflict Shield
As an exercise in self-awareness and improvement, class members create a Conflict Shield listing 12 skills they believe are the most useful in conflict resolution. They then color the ones they have mastered while leaving uncolored those...
Curated OER
What Do I Want To Be When I Grow Up?
Students divide careers into clusters. In this vocational technology lesson plan, students prepare a PowerPoint presentation of one of the six career clusters. Working in small groups, students organize a variety of careers into the...
Curated OER
Why Muscle Biology?
Students research and define a muscle biology research question and organize an experiment to address the question utilizing either NADH staining or acid buffering. They analyze data as well as draw conclusions about their research....
Curated OER
Car Maintenance Costs
In this literacy worksheet, students practice interpreting data that is focused upon organizing the costs of car maintenance and the details of planning for future costs.
Curated OER
Making Money and Spreading the Flu!
Paper folding, flu spreading in a school, bacteria growth, and continuously compounded interest all provide excellent models to study exponential functions. This is a comprehensive resource that looks at many different aspects of these...
National Security Agency
Are You Ready to Call the Guinness Book of Records?
Learners design questions that can be answered by collecting data. In this line-plot lesson, pupils collect data and graph on a line plot on world records. An abundant supply of teacher support is provided in this resource.
Curated OER
Quarter, Nickel, Dime....
An engaging game called, "Quarter, Nickel, and Dime" is presented in this math lesson. Players are given an envelope with slips of paper that represent the three coins. In pairs, they play the game 18 times, and the whole class charts...
Curated OER
The O Zone-Code Read Alert
What are the effects of an air quality alert? Expert groups receive one component of air quality information resources to study. Pupils then jigsaw into new groups and share their knowledge. Finally, they draft a statement of what they...
Curated OER
Math Investigations 2
Young mathematicians practice measuring and graphing skills while working in groups to measure objects found in the classroom. Using their measurements, they create one bar graph displaying the lengths and another displaying the widths.
Curated OER
Statistics and Shopping
Learners explore the concept of using consumer data and statistics to aid in the consumer decision making process. For this consumer data and statistics lesson, students research consumer data and statistics. Learners analyze the data...
Curated OER
Super Spreadsheets
Learners develop a spreadsheet containing statistical data. They describe and interpret the data to make conclusions. They review the differences between an unorganized spreadsheet verses an organized one.
Curated OER
Keep It Cool
Students complete a science experiment to study insulation, heat transfer, and permafrost. In this permafrost study lesson, students design and test a soda insulator. Students graph their class data and discuss the results. Students...
Curated OER
Identifying Creatures
Young scholars use a classification key from a provided worksheet to identify creatures. This task assesses student's abilities to interpret data, make decisions, identify, and classify.
Curated OER
Puddles and Soil
Students determine which of several soil samples (sand, soil, and slit) produces puddles, providing insight into the permeability of these different soils. This task assesses students' abilities to make simple observations, collect,...
Curated OER
Graphing Fun In Third Grade
Third graders display information in a graph, table, and chart. In this data lesson plan, 3rd graders look at graphs, tables, and charts, discuss their importance, and make their own.
Curated OER
Changes in Pulse Rate
Eighth graders practice making observations and collecting data after determining a baseline pulse rate then collect data on the changes in that rate with exercise. Students must organize their data and analyze their observations.
Curated OER
Different Perspectives of Oregon's Forest Economic Geography
Young scholars map data on employment in wood products manufacturing in Oregon counties. In this Oregon forest activity, students discover the percentage of people employed in the forest manufacturing industry. Young scholars create a...
Curated OER
Probability With a Random Drawing
Young scholars define probability, and predict, record, and discuss outcomes from a random drawing, then identify most likely and least likely outcomes. They conduct a random drawing, record the data on a data chart, analyze the data,...
Curated OER
Tulip Graphing
Students create a graph of tulip growth. In this data analysis lesson, students plant tulip bulbs and use graph paper to begin graphing data on the growth of the tulip.
Curated OER
Rolling Down Hill
Students perform an experiment, collect, and analyze data of a rolling marble down a ramp. They report results after they complete their experiment. Students are assessed in science and writing.
Curated OER
Internet Field Trip: Simple Machines
Learners observe and identify the types of simple machines. They conduct research and gather data to increase the comprehension of simple machines. Students identify and comprehend data to complete a graphic organizer and focus...
Curated OER
Frequency Distributions and Measures of Central Tendency
Twelfth graders use the Internet to research information on NFL players and construct frequency distributions from the data. They calculate the mean, medium and analyze their data.


