Curated OER
Blue
Students follow directions for a simple chemical experiment. They use the appropriate tools and techniques to gather, analyze, and interpret data. Students identify a substance that has characteristic properties, such as density, a...
Curated OER
Fast Food: You Can Choose!
Learners research the nutritional value of fast food. They assess which fast foods are best and worst to eat. They organize their data into tables and graphs and explain their findings to other students.
Curated OER
Bar Graphs
In this bar graphs worksheet, students, working with a partner, explore how to read and analyze the five answers to one mathematical bar graph.
Curated OER
Watts Up Doc?
Students examine the wattage of a light bulb using math. In this algebra lesson, students find the inverse square of given parameter. They work in groups collecting and analyzing data.
Curated OER
Get a Half Life!
Eighth graders use M&M's to experiment with data. They use a graphing calculator to determine the best equation for their data; linear, quadratic or exponential. They analyze the data to find the half-life of their M&M's.
Curated OER
Graphing Valentine Candies
Fifth graders organize and display information in bar graph form using appropriate labels. Each student receives a box of Valentine heart candies, a worksheet of the tally chart and a worksheet of the bar graph.
Curated OER
Crustal Sinking
Students measure the rate of sinking of a test tube into a beaker of "glop", representing a model of the interaction between the Earth's crust and upper mantle. This task assesses students' abilities to make simple observations,...
Curated OER
Simple Bar Graphs Using Excel
Students create original survey questions, and develop a bar graph of the data on paper. They input the survey data using two variables onto an Excel bar graph spreadsheet.
Curated OER
Get a Half-life!
Students use m&m candies as their sample set. They begin by counting the total number of candies to determine their sample size. Students put the candies into a cup and shake them gently before pouring them onto a paper plate. Count...
Curated OER
Starch and Sugar Testing 1
Eighth graders determine the presence of starch and sugar in unknown solutions. This task assesses students' abilities to observe, record and interpret data, classify, generalize/infer, construct data tables, and identify sugar and...
Curated OER
Graphing Made Easy
Fourth graders discover the appropriate way to construct and analyze bar, line, picto, and circle graphs. They set up frequency tables and perform some statistical analysis (mean, median, and mode) on their data.
Curated OER
More Bait for Your Buck!
Students determine where to buy the heaviest earthworms as they study invertebrates. They create a double bar graph of the results of the weight data.
Curated OER
Changing Ramp Heights
Learners conduct an experiment to determine how the change in ramp height affects the distances a ball is able to move a stationary cup. Data is collected from several trials and recorded and analyzed.
Curated OER
Community and Me
Students continue to examine the concept of communities. In groups, they identify and create a list of their needs and wants and create artwork showing their community working properly. They describe the differences in communities...
Curated OER
Different! Diverse! Dynamic! Lesson 1: Late Bloomers
Young scholars examine how people grow and mature at different rates. They create a graph and a timeline to organize the data they collect.
Curated OER
Investigating the Shapes of Covalent Molecules and Measuring their Respective Bond Lengths and Bond Angles
High schoolers will draw Lewis structures of common covalent compounds using a Chem 3D computer program. They will predict the shapes of the molecules, complete a data table, and formulate rules for predicting shapes of molecules. In the...
Curated OER
Climate Watch
Students participate in a national survey of biological indicators of climate change by gathering and submitting data on local plants and animals.
Curated OER
Mystery Paint
Students use the scientific method to determine the properties of various kinds of paints, use collected data to identify paint samples that are not properly labeled and use proper science safety techniques while working with chemical...
Curated OER
Density of Minerals
Students determine the mass, volume, and density of two different mineral samples. Students show data and calculations as well as answer questions about the mineral identities.
Curated OER
Just Graph It!
Students practice collecting data and organizing it into graphs. As a class, they collect birthday information from each of their classmates. To continue practicing, they examine the characteristics of different bugs and zoo animals. ...
Curated OER
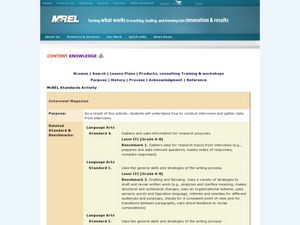
Interview! Magazine
Students interview a subject and write a biographical sketch for a fictional magazine. In this interview lesson, students choose a person to interview and create two sets of questions. Students conduct the interview. Students then write...
Curated OER
Measuring Mania
Students rotate through stations in the classroom, completing different types of measurements. These measurements are placed into a spreadsheet, and a scatter plot is generated. They type an explanation of their results in correlation...
Curated OER
A Day at the Beach
Student read Sheryl Wilson's story, "A Day at the Beach" while classifying items they find. They design a chart of the items before using educational graphing software to create a graph.
Curated OER
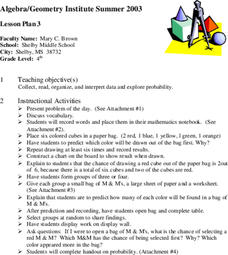
Exploring Probability
Fourth graders participate in a lesson that explores probability. They use candy and model cubes to experiment with different outcomes that can be charted if the students can proceed to the objective of the lesson. They discover how...


