Curated OER
Unemployment, NAIRU, and the Phillips Curve
Students participate in three different lessons. They analyze the relationship between fiscal expansion and short and long run consequences using the AS/AD framework. They organize appropriate data from a range of sources. They interpret...
Curated OER
Probability Plus
Students participate in a variety of activities to understand statistics. They collect and interpret data. Also students distinguish the difference between a population and a sample. They make inferences and create arguments using data.
Curated OER
Twelve Days of Christmas
Learners create charts and graphs using a spreadsheet. They chart the number of each gift given day by day from the song, "The Twelve Days of Christmas." They create a bar graph and a circle graph from their data on the spreadsheet.
Curated OER
Animal Investigation
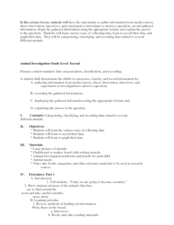
Third graders gather information and classify animals. In this animal investigation lesson, 3rd graders research animals, and organize the information into notebook.
Curated OER
Mother May I?
Third graders measure distance using nonstandard units of measure. In this measurement lesson, 3rd graders measure a given distance through the use of the game "Mother May I?" Student gather and compare data on how many "giant steps" and...
Curated OER
Is Temperature Effected By How Close You Are to the Equator
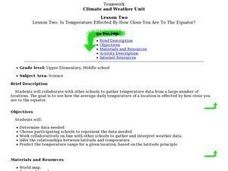
Students collaborate with other schools to gather temperature data from a large number of locations. They determine how the average daily temperature of a location is affected by how close you are to the equator.
Curated OER
A Woman's Place in the House of Commons
Students become familiar with the role women play in the Canadian government. They gather, organize and analyze data on female politicians.
Curated OER
Fast Food Survey Using Bar Graphs
Second graders conduct survey and sort data according to categories, construct bar graph with intervals of 1, and write a few sentences about their graphs.
Curated OER
Theoretically Speaking
Students define probability. They determine outcome from a given situation based on simple probability. Students create experimental data using a coin and a number cube. They write how theoretical and experimental probability are different.
Curated OER
Atlatl Lessons
Fifth graders study math patterns and relationships as well as learn about the heritage of Aboriginal peoples of Saskatchewan. In this patterns and heritage lesson, 5th graders research the daily lives of First Nations People in...
Curated OER
Mapping My Community
Ninth graders are introduced to GPS technology. They complete fieldwork as they visit a specific area of their community to identify and map types of land use in the surveyed area. They use the collected data to create a digital map.
Curated OER
Let's Go Camping
Fifth graders plan a budget for a camping trip. They use a spreadsheet to organize the budget and word processing justification for their choices.
Curated OER
Calculating & Graphing Using a Spreadsheet
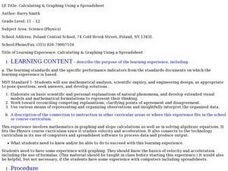
Students use the lab apparatus to calculate the average velocity and average acceleration at several points and record the data. They use the spreadsheets to plot distance vs. time, velocity vs. time and acceleration vs. time graphs.
Curated OER
Watersheds:Stream Channels And Post-fire Stream Flows
Students draw cross sections of a stream channel from field data. In the field, using a GPS, they determine the depth of a stream channel and use a spreadsheet to graph the stream channel.
Curated OER
A Canadian Inventory: The Way We Are!
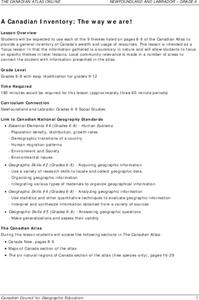
Students use the Canadian Atlas to discover an inventory of Canada's wealth and usage of resources. Using charts and graphs, they produce a wall of selected data of importance to the country and identify one issue of sustainability. ...
Curated OER
Heads-Up Probability
Second graders use tree diagrams to predict the possible outcomes of coin tosses. The data they collect and graph also help them predict the likelihood of getting heads or tails when tossing coins the next time.
Curated OER
Beyond "Ranger Rick"
Students explore the information which can be obtained from periodicals. Groups of students formulate questions to research and determine the main idea to use to obtain the data for their specific topics.
Curated OER
Rainforest Deforestation and the Water Cycle
Students create terrariums (mini rainforests). They observe and discuss the life processes that occur in their terrariums and how changes in these processes affect the plants and organisms inside. They collect and graph data and present...
Curated OER
Historical Figures
Student research a "Historical Individual" using the Internet. They print a minimum of five articles and organize them. They create a visual biography of their historical figure.
Curated OER
Math: Collecting and Analyzing Date
Children count how many of an activity they can do in a row, such as ball tossing and record the date and count. Children track over a period of time and graph results.
Curated OER
Water Quality Monitoring of Natural Water
Students set up their own monitoring system. They collect samples from an appropriate sampling site. They analyze data and determine the water quality. They present their information to the class and draw a conclusion.
Curated OER
Clean Sweep
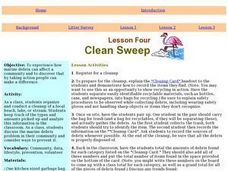
Students organize and conduct a cleanup of a local beach, lake, or stream. They keep track of the types and amounts picked up and analyze this information in the classroom.
Curated OER
Tag It and Bag It: Archeology Lab Lesson
Seventh graders practice analyzing, collecting and categorizing artifacts. Using charts, they organize and interpret information about the artifacts they classified. They work together to create a graph to represent class totals and...
Curated OER
Elements of Culture
Sixth graders work in small groups to research an ancient culture using guide questions. They use note-taking and research skills, and organize their research information using a software graphic organizer program. They create a museum...


