Curated OER
Why Is Our Stream Changing?
Learners test turbidity, pH, oxygen content and temperature of local stream. In this earth science instructional activity, students collect and record data from the experiment. They analyze findings and present it to class.
Curated OER
How Deep is the Ocean
Students predict and then analyze the layout of the tectonic plates that form the ocean's floor using mapping skills and Inquiry based problem solving, They compare the depth of various regions in the ocean with the geologic age to...
Curated OER
Sherlock Holmes Database Investigation
High schoolers conduct a character study using the literature of Sherlock Holmes. They use a database with different cases that need to be solved. Students use the computer software to work through a list of suspects and match them with...
NOAA
Into the Deep
Take young scientists into the depths of the world's ocean with the second activity of this three-part earth science series. After first drawing pictures representing how they imagine the bottom of the ocean to appear, students...
Curated OER
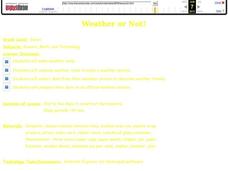
Weather or Not!
Seventh graders discuss weather. In this meteorology lesson, 7th graders view a movie on weather and take a quiz. They work in groups to make weather tools for a class weather station.
Center for Learning in Action
Density
Explore the concept of density within states of matter—gases, liquids, and solids—through a group experiment in which young scientists test objects' texture, color, weight, size, and ability to sink or float.
Curated OER
Nutty For Nutrition
Research the nutritional value of food by having groups of high schoolers conduct Internet research to determine healthy food choices. They calculate the nutritional value of the food and create a PowerPoint presentation indicating the...
Curated OER
Ozone Hole Expert Groups
Research topics associated with the hole in the ozone layer over Antarctica. Researchers write five facts about their topic and one question for each of those facts. They present what they learned to the rest of the class. Six topics are...
Curated OER
Alphabet Study
Fifth graders predict what they believe the five most common letters are in the English language. After sharing their predictions in a group, they develop a new list of the most common letters used. Using a book, they count the number...
Curated OER
How Can You Study Things You Can’t See Like: Atoms?
Learners simulate how scientists studied things they can't see like atoms. In this chemistry lesson, students predict what is inside the numbered obsertainers. They design a way to investigate what's inside without opening it.
Curated OER
Firewood Problem
Students write and solve their own story problems. They determine the cost of firewood by the cord. They organize their data in graphs and charts.
Curated OER
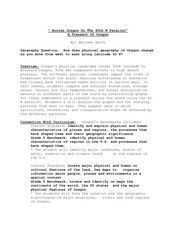
"Across Oregon On The 45th N Parallel" A Transect of Oregon
Students explore the physical geography of Oregon. In groups, students collect weather and elevation information on Oregon. They organize the data and create maps and graphs of the information. Afterward, students compare the...
Curated OER
Let it Grow and See What Happens
Students participate in an experiment in which they try to stop algae from growing. In groups, they develop a hypothesis and test it while making changes to the experiment along the way. They make observations and organize their data...
Curated OER
Gravel Run - Freshwater Spring
Learners perform five lab experiments dealing with water run. Students monitor gravel run water quality. They conduct a bioassessment and collect information on water quality. Learners organize and analyze collected data.
Curated OER
Death On Board La Belle: Finding Clues from Old Bones
Students practice analyzing skeletal remains for clues by using the Internet. In this scientific investigation lesson, students research the La Belle shipwreck using the Internet and written materials, later completing a Skeletal Report...
Curated OER
Evidence of Change Near the Arctic Circle
Students analyze graphs and make conclusions about climate change. In this climates lesson students produce graphs and identify relationships between parameters.
National Gallery of Canada
Counting Circles
Learners look at bands of colors and estimate how many rings of color there are. While working in groups, they come up with a plan of how to accurately count the rings. They attempt to find a pattern in the colors, and decide whether...
Curated OER
What's Shaking? Three-Lesson Unit
Your young architects use the Internet to research tall structures or sky scrapers to help in the design of their scale drawings. This is lesson one of three in which learners design, build, and test model skyscrapers for seismic safety....
Curated OER
"If you build it..."
Students utilize prior knowledge to erect and assemble a building from a drawing using spaghetti noodles and marshmallows. In this building lesson, students visualize a three dimensional structure from looking at a picture and converting...
Curated OER
Shake, Rattle, and Roll
Students make an earthquake simulator and test their structure to see if it lasts through the earthquake. In this earthquake lesson plan, students make a structure and test and record the results from an earthquake simulator made out of...
Curated OER
Beacons of Light
Students research Internet sites for lighthouses. In this lighthouses lesson plan, students learn facts about lighthouses in the United States. Students complete a related worksheet and share their information with the class.
Curated OER
Ecosystems
Students create plots of land in three different ecosystems and use AppleWorks to collect data for research. This lesson includes a downloadable worksheet and can be accomplished in four days.
Curated OER
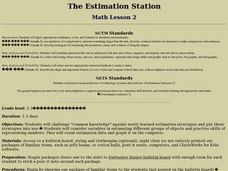
The Estimation Station
Students challenge "common knowledge" against newly learned estimation strategies and put those strategies into use. They consider variables in estimating different groups of objects and practice skills of representing numbers.


