Curated OER
What are Igneous Rocks and How are They Formed?
Crystals form before your very eyes! What sixth grader wouldn't enjoy this lesson plan on igneous rock formation? Using hot Salol, junior geologists observe the crystal formation process as the material cools. This comprehensive lesson...
Curated OER
Making Money and Spreading the Flu!
Paper folding, flu spreading in a school, bacteria growth, and continuously compounded interest all provide excellent models to study exponential functions. This is a comprehensive resource that looks at many different aspects of these...
Curated OER
Mineral Matters
Students work in a team to use the ProScope Digital USB Microscope and a computer to collect microscopic images from a variety of mineral specimens. They compare specimens and determine how they are alike and different by comparing their...
NTTI
Line 'Em Up!
Coordinate planes and Cartesian graphing systems are the focus of this math lesson. Learners use video, internet activities, and engage in hands-on activities in order to explore coordinate planes. The materials needed for this lesson...
Curated OER
Quarter, Nickel, Dime....
An engaging game called, "Quarter, Nickel, and Dime" is presented in this math lesson. Players are given an envelope with slips of paper that represent the three coins. In pairs, they play the game 18 times, and the whole class charts...
Curated OER
Yellow Pages Ad-dition
Students determine the revenue generated by sample pages from the Yellow Pages. They discuss the value of advertising a business in this venue. They use the local telephone directory and some fictitious ad rates to lead their inquiry.
Curated OER
Keep It Cool
Pupils complete a science experiment to study insulation, heat transfer, and permafrost. In this permafrost study lesson, students design and test a soda insulator. Pupils graph their class data and discuss the results. Students discuss...
Curated OER
Rolling Down Hill
Students perform an experiment, collect, and analyze data of a rolling marble down a ramp. They report results after they complete their experiment. Students are assessed in science and writing.
Curated OER
Get a Half Life!
Eighth graders use M&M's to experiment with data. They use a graphing calculator to determine the best equation for their data; linear, quadratic or exponential. They analyze the data to find the half-life of their M&M's.
Curated OER
Different Perspectives of Oregon's Forest Economic Geography
Students map data on employment in wood products manufacturing in Oregon counties. In this Oregon forest lesson, students discover the percentage of people employed in the forest manufacturing industry. Students create a box and whisker...
Curated OER
Get a Half-life!
Students use m&m candies as their sample set. They begin by counting the total number of candies to determine their sample size. Students put the candies into a cup and shake them gently before pouring them onto a paper plate. Count...
Curated OER
Investigating the Shapes of Covalent Molecules and Measuring their Respective Bond Lengths and Bond Angles
High schoolers will draw Lewis structures of common covalent compounds using a Chem 3D computer program. They will predict the shapes of the molecules, complete a data table, and formulate rules for predicting shapes of molecules. In the...
Curated OER
Multiplication Word Problems
In this worksheet students will solve word problems that involve multiplication, addition and money using a table to organize the data. Students are then asked to determine which person in the problem made more money.
Curated OER
M&M Exponential Activity
Students create a scatter plot of their experimental data. In this algebra lesson, students use M&M's to determine an algebraic model. They discuss results in class.
Alabama Learning Exchange
What's Your Favorite Chocolate Bar?
Young scholars complete a math survey. In this math graphs lesson, students complete a survey about their favorite candy bars. Young scholars create different kinds of graphs using Microsoft Excel to show their results.
Curated OER
Geometric Relatioships
Students explore measurements and geometric formulas. In this geometry lesson, students investigate pi as it relates to geometry. They collect data and use a chart to organize the data.
Curated OER
Leaping Lemurs! How far can you jump?
Students watch a segment of the PBS video which show the lemurs' ability to jump. In pairs, students collect measurement data involving each other's length of a standard step, a standing broad jump, and a long jump. They record their...
Curated OER
One Hundred Hungry Ants
Primaries read the book One Hundred Hungry Ants and solve word problems based on the book. In this word problems lesson plan, students will be able to find the factors of a number by organizing counters into equal rows.
Curated OER
An Enzyme- Substrate Model
Students explore reaction rates of an enzyme-mediated reaction. They examine the effects of environmental variables on enzyme function. Students collect, graph, and analyze data relating to the reaction.
Curated OER
Paper Parachutes
Students participate in a simulation of a parachute-jump competition by making paper parachutes and then dropping them towards a target on the floor. They measure the distance from the point where the paper parachute lands compared to...
Curated OER
Vacation Matrix-Integrated Core
Students read aloud, "The Best Vacation Ever," by Stuart Murphy locate vacation spots on a map and describe their own vacations. Students illustrate their summer vacation spot and describe the vacation, placing it on a "vacation matrix"...
Curated OER
Make a Graph
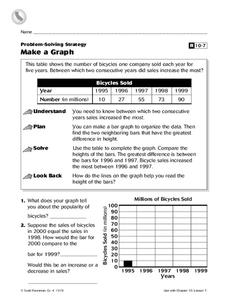
In this graphs worksheet, 4th graders, after studying and analyzing a table on bicycles sold within several years, answer 2 short answer questions relating to the table.
Curated OER
Firewood Problem
Students write and solve their own story problems. They determine the cost of firewood by the cord. They organize their data in graphs and charts.
Curated OER
Box Plots
Students review the concept of median, explore how to calculate quartiles for any size data set and experience how to build a box plot.


