Curated OER
Ocean Botttom Profile
Students interpret a graph of ocean depths and topographic features. This task assesses students' abilities to interpret figures, organize and represent data, apply knowledge of scale to a profile, and apply theoretical knowledge.
Curated OER
What's The Big Deal About Accutane?
Students take on the role of epidemiologists. They investigate an "outbreak" in serious birth defects that occur in infants born to teenage girls. students discover a link between the use of the acne drug called Accutane and birth defects.
Texas State University
Earth: Deposition and Lithification
Geology geniuses analyze sediment samples with a hand lens and sort according to physical characteristics. They also learn about the processes of cementation, compaction, and lithification within the rock cycle. The lesson plan is...
Curated OER
A Look at the Population Density of the United States
Students acquire census information and create maps of the population density of the United States on different scales. They role play the roles of workers of a retail company and they use the population data to market to their customers.
Curated OER
Water Usage and Conservation
Pupils investigate water usage at school and at home. They use graphs and tables to evaluate water usage. Students describe possible water conservation measures. They use graphs and tables to relate data as part of a written report.
Curated OER
Analyzing Cubes
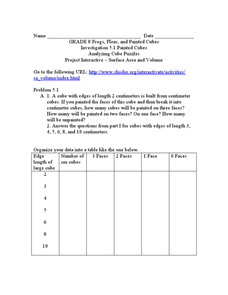
In this analyzing cubes worksheet, 9th graders solve and complete 6 different types of problems. First, they organize the given data into the table provided. Then, students study the patterns in the table and tell whether the pattern of...
Curated OER
Box-and-Whisker
Seventh graders are introduced to the concept of box-and-whisker plots. A step-by-step process for creating a box-and-whisker plot is provided. The goal of the lesson is that students study the components of a box-and-whisker plot and be...
Curated OER
Mr. Cobbler's Shoe Dilemma
Students employ statistics to solve real-world problems. They collect, organize and describe data. They make inferences based on data analysis. They construct, read, and interpret tables, charts and graphs.
Curated OER
Population Density
Students use the scientific method to conduct an experiment and use varied methods to gather background information. They correctly use lab equipment and prepare tables and graphs that organize, conclude, and present their findings. ...
Curated OER
Using Computers to Produce Spreadsheets and Bar Graphs
Students review graphing terminology and how to plot data points, how to input data into a spreadsheet, and how to make a chart using a computer.
Curated OER
Exploring Function Graphs
Tenth graders investigate three different sets of data that relate temperature to another variable in the physical world. These illustrate linear, inverse and exponential relationships.
Curated OER
Gathering, Evaluating, And Organizing Information for a Report
Students gather and organize information for a research report on a topic of their choosing. Each students selects a subject for their research. Using traditional and electronic data they reference four or more appropriate resources...
Curated OER
Cold Enough?
Students read and record temperatures and display the data. They represent the temperatures on an appropriate graph and explain completely what was done and why it was done. Students display the data showing differences in the daily...
Curated OER
Tracking Your Favorite Web Sites
Ninth graders track the hit count on their favorite web sites. In this Algebra I lesson, 9th graders record the number of hits on their favorite web site for twenty days. Students explore the data to determine if the relation defines a...
Curated OER
Charting a New Course
Students calculate the distance they will travel. In this geometry lesson, students use the TI and CBL system to make calculation of a certain path. They explore geography by calculating distances between different areas as it relates to...
Curated OER
Infinite Secrets
Students duplicate the method that Archimedes used to estimate the value of pi. They complete a data table and find the approximate values of pi for three sets of polygons.
Curated OER
What's Poppin'?
Second graders determine and compare weights and volumes of popped and unpopped corn to make predictions and solve problems. Students combine the data of each group into a graph. They construct questions, statements and story problems...
Curated OER
Bruchid Investigations: Bruchid Development Investigations
While this lesson plan is based on the Bruchid beetle, the focus is on conducting a scientific investigation. Ecology explorers vary the temperature or the type of leaf that Bruchid eggs are laid on and test for effects on the...
Curated OER
The Twelve Days of Christmas
Students purchase gift items and practice collecting, analyzing, computing, and recording information. In this data lesson plan, students also complete money equivalent activities.
Curated OER
Algebraic Thinking - Equations
Fifth graders explore equality and inequality by participating in a Tilt/Balance activity. The students listen to the story "Lemonade for Sale" by Stuart J. Murphy and use equations to graph lemonade sale profits.
Curated OER
Creating/Improving the International Space Station
Students research space and gravity and understand the difficulties humans have while on the International Space Station. In this space lesson plan, students listen to personal accounts of astronauts on videos and present designs to...
Curated OER
Giants of the Century
Middle and high schoolers study significant people who shaped the 20th-century history and are introduced to database tools. Researchers use the Internet to research five 20th century history makers. They write a short biography of five...
02 x 02 Worksheets
Inverse Variation
Discover an inverse variation pattern. A simple lesson plan design allows learners to explore a nonlinear pattern. Scholars analyze a distance, speed, and time relationship through tables and graphs. Eventually, they write an equation to...
Curated OER
Hot and Cold Colors
Students experiment with the color and solar energy absorption. In this color and solar energy absorption lesson plan, students spend two days discussing and experimenting with the concept of energy absorption. They paint cans with...


