Curated OER
The Behavior of Ants
Students use the steps of the Scientific Method to develop and test their own ideas through experimentation with ants.
Curated OER
Building Shapes From Numbers
Students experience how to illustrate some of the many connections between number and geometry. Through this 2-3 day focus on square numbers and triangular numbers, students make connections among mathematical topics.
Curated OER
Ready for Roots
Fourth graders sort seeds and predict what conditions are needed for them to germinate. They keep the seeds moist, observe and measure their growth and graph the results. As the seeds start to grow students compare and contrast the each...
Curated OER
A Fishy Tale
Eighth graders do a research project on a particular species of Atlantic seafood and record and graph information pertaining to commercial landings of that species of seafood. They use a website and an Appleworks spreadsheet.
Curated OER
Exploration of 'pill bugs'
Fifth graders define words. They create a dichotomous key. After carefully examining pill bugs, 5th graders record observations. They compare and contrast habitats of pillbugs.
Curated OER
The Three Gorges Dam- Should it be Completed?
Students research and analyze the geographic problem of whether or not the Three Gorges Dam should be completed. Students take a position on the issue, gather information related to their position, present their conclusions, and write a...
Curated OER
Graphing Regions: Lesson 2
Students identify and analyze geographical locations of inventors. They each identify where their inventor is from on a U.S. map, discuss geographic patterns, and create a t-chart and graph using the Graph Club 2.0 Software.
Curated OER
Student Costs Graph
Students calculate the mileage, gasoline costs, and travel time and costs for a vacation. They conduct a virtual field trip, and create a comparison graph of costs using Microsoft Excel software.
Curated OER
M&M Math
Pupils sort a bag of M&M candies according to color using a sorting mat. They count M&M candies. They compare the number to their prediction then students create tally charts.
Curated OER
Design-A-Room Project (Part 3 of 3)
Students culminate a unit on measurement with a focus on area and perimeter. They design a floor plan of their dream room on graph paper showing the proper area and perimeter. They plan the budget for their room and make a 3-D scale...
Curated OER
Graphing Favorite Holidays
Students create spreadsheets and bar graphs based on results of survey of favorite holidays.
Curated OER
Mapping the Blue Part
Eighth graders determine the location of specific features of the stimulated ocean floor. The features include the continental shelf, continental slope, an ocean trench, and a mid-oceaniz ridge.
Curated OER
Arrange the Classroom (Part 1 of 3)
Fifth graders arrange the classroom using all the moveable objects and through the exploration of area and perimeter. They determine the area of the classroom, create and label model pieces of furniture using graph paper, and create a...
Curated OER
Butterflies
Students will explore the life cycle of the Painted Lady butterfly by raising their own. They will incorporate math, science, and language arts as they graph, pattern, journal, observe, and artistically create.
Curated OER
Super Sort
Students sort objects based on one characteristic. They define the term "attribute" and give examples of attributes of objects. Students explain their reasoning for sorting objects into groups.
Curated OER
Line 'Em Up!
Students find coordinate points on a grid and create a line graph with those points. This lesson should ideally be used during a unit on various types of graphs. They make and use coordinate systems to specify locations and to describe...
Curated OER
Do You Feel Lucky?
Young scholars explore probability by using games based on probable outcomes of events. They name all of the possible outcomes of an event and express the likelihood of such an event occurring.
Curated OER
India and Pakistan: Rivals from Birth
Seventh graders, after being divided into two groups, are assigned either Pakistan or India. They conduct research using the Internet, reference books, and magazines. The class compares and contrasts the two countries to find sources of...
Curated OER
Curious Clouds
Second graders explore clouds. They read The Cloud Book by Tomie dePola. Students sort the cloud pictures into three categories. Students create a graph using the cloud pictures. They use Excel to create a bar graph.
Curated OER
Fire!, Probability, and Chaos
Upper elementary and middle schoolers work with the concept of probability. They are introduced to the concept of chaos. Learners graph and analyze using a line plot, work with mean, and are introduced to the concept of variance.
Curated OER
Schoolyard Bird Project
Students observe and count bird sightings around their schoolyard throughout the school year.
Curated OER
Cover and Boarders
Students find the area and perimeter of rectangular figures. They use this information to find patterns and discover relationships between area and perimeter. Students apply and explain formulas relating to perimeter, area, and volume.
Curated OER
Maximize It!
Students design a rectangular box without a lid that has the largest possible volume using the supplied sheet of centimeter graph paper. They work in groups to construct different size boxes to determine the largest possible volume and...
Curated OER
Shadow Casting
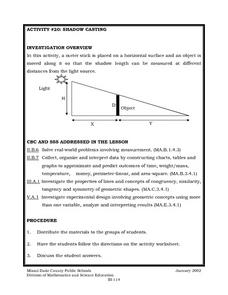
Eighth graders use a meter stick that is placed on a horizontal surface and an object is moved along it so that the shadow length can be measured at different distances from the light source. They solve real-world problems involving...


