University of Texas
Inside Mathematics: Our Pets [Pdf]
This task challenges a student to demonstrate understanding of concepts involved in representing and interpreting data.
Google
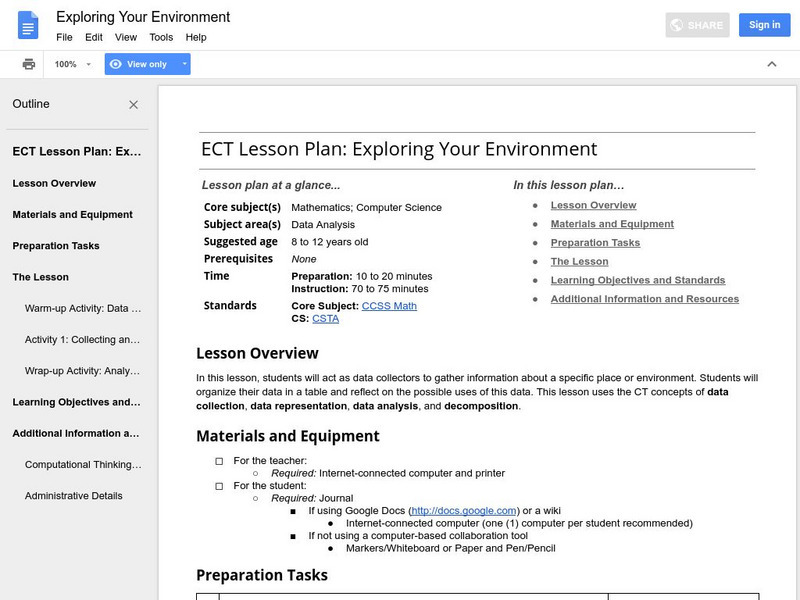
Google for Education: Exploring Your Environment
Students act as data collectors who gather different types of information about various things in the environment. Students then organize the data in a table and reflect on the possible uses of this data.
Alabama Learning Exchange
Alex: Get on Your Mark, Get Set, Go!
In collaborative/cooperative groups, students will review basic vocabulary and concepts for data and statistics. Students will create, collect, display, and interpret data in the form of frequency tables, bar graphs and circle graphs.
Other
Nearpod: Displaying Data: Dot Plots
In this lesson, students will learn how to create and intrepret dot plots.
University of Texas at Austin
Mathematics Teks Toolkit: The Sounds of Music
In this lesson plan, students collect data, graph it, then determine the period and frequency of the sound waves made by a guitar.
Alabama Learning Exchange
Alex: Heads Up!
The lesson plan is a hands-on project. Middle schoolers will work in pairs to gather various measurements, organizing the data into a provided chart. The measurements will be used to review, reinforce, and introduce skills such as...
Alabama Learning Exchange
Alex: Getting to Know Your Classmates Using Bar Graphs
Students will collect data from class using surveys. Students survey classmates concerning favorite movies, favorite color, shoe size, time spent studying, brand of cell phone and etc. From the data they will create bar graphs using an...
Alabama Learning Exchange
Alex: How Long Will It Take?
In this lesson, students will participate in a group activity using a sponge ball and a growing human circle. The students will be added to a circle in groups of two and will pass the sponge ball from hand to hand until it returns to the...


![Inside Mathematics: Our Pets [Pdf] Lesson Plan Inside Mathematics: Our Pets [Pdf] Lesson Plan](https://d15y2dacu3jp90.cloudfront.net/images/attachment_defaults/resource/large/FPO-knovation.png)


