Sophia Learning
Sophia: Using Graphs to Analyze Data
This lesson will demonstrate how to analyze and interpret data given in the form of a graph.
E-learning for Kids
E Learning for Kids: Math: Music, Dance Performance: Chance & Data
Nadir and his family play in a band. Can you help him get all the instruments together? In these activities, students will write data using symbols, use one object to represent one item, create a column graph, and determine whether...
Texas Education Agency
Texas Gateway: Graphing Data to Demonstrate Relationships
Given problem situations, the student will graph data with a constant rate of change to demonstrate relationships in familiar concepts, such as scaling.
TED Talks
Ted: Ted Ed: Hans Rosling Shows the Best Stats You've Ever Seen
Explore collected data in regards to life expectancies, family size, and finances through out the world and the various ways the data has been displayed.
Math Is Fun
Math Is Fun: Cumulative Tables and Graphs
Explains, with examples, how values can "accumulate" in tables and graphs. Includes ten practice questions.
Google
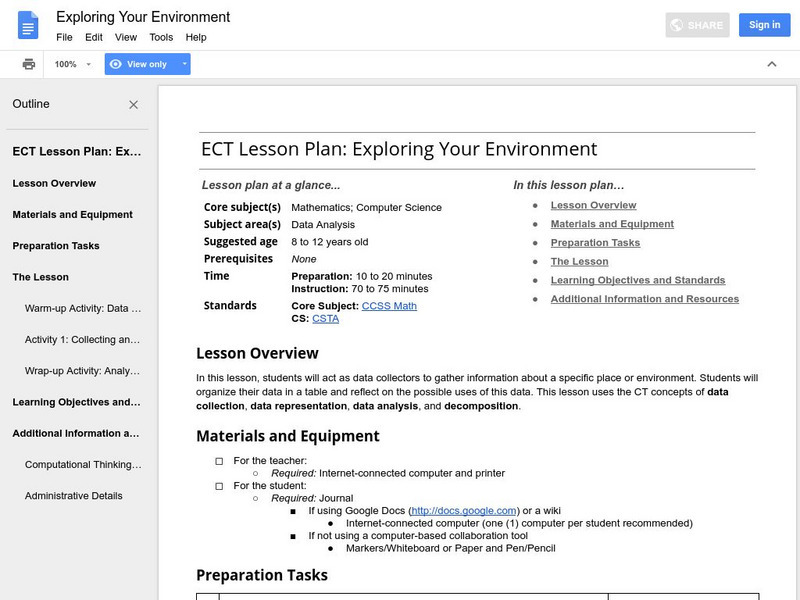
Google for Education: Exploring Your Environment
Students act as data collectors who gather different types of information about various things in the environment. Students then organize the data in a table and reflect on the possible uses of this data.
National Council of Teachers of Mathematics
Nctm: Figure This: Does It Make a Difference Where You Shop?
A math investigation that uses scatter plots to compare prices of favorite soft drinks. Discover how valuable your skills in organizing and displaying data can be in real life scenarios.
Texas Instruments
Texas Instruments: Gemini Candy
In this activity, students work in groups to collect data and draw conclusions from random samples simulated by drawing tiles from a bag. They represent the data collected in the form of a triple bar graph.
Rice University
Rice University: Cynthia Lanius: Fun and Sun Rent a Car
A wide range of math skills is incorporated into a lesson that involves planning a family's vacation to Florida. Travel expenses are gathered and compared, graphed, and analyzed in hopes of finding the best prices. There are extension...
University of Cambridge
University of Cambridge: Maths and Sports: Our Sports
What events are there in your school sports day, and in the Olympic Games? What are your favourite races and sports? This activity encourages discussion and decisions about how to collect and display data, and is designed to be...
University of Cambridge
University of Cambridge: Maths and Sports: Match the Matches
Decide which charts and graphs represent the number of goals two football teams scored in fifteen matches. This data handling activity is designed to get children talking meaningfully about mathematics, presenting and justifying...
Alabama Learning Exchange
Alex: Get on Your Mark, Get Set, Go!
In collaborative/cooperative groups, students will review basic vocabulary and concepts for data and statistics. Students will create, collect, display, and interpret data in the form of frequency tables, bar graphs and circle graphs.
Other
Nearpod: Displaying Data: Dot Plots
In this lesson, students will learn how to create and intrepret dot plots.
University of Texas at Austin
Mathematics Teks Toolkit: The Sounds of Music
In this lesson plan, students collect data, graph it, then determine the period and frequency of the sound waves made by a guitar.
BBC
Bbc: Ks1 Bitesize: How to Use Simple Data Tables
Explains how to read information from a simple golf scoring table. Students then label the rows and columns in a 2x3 table. [0:26]
Alabama Learning Exchange
Alex: Heads Up!
The lesson plan is a hands-on project. Middle schoolers will work in pairs to gather various measurements, organizing the data into a provided chart. The measurements will be used to review, reinforce, and introduce skills such as...
Alabama Learning Exchange
Alex: Getting to Know Your Classmates Using Bar Graphs
Students will collect data from class using surveys. Students survey classmates concerning favorite movies, favorite color, shoe size, time spent studying, brand of cell phone and etc. From the data they will create bar graphs using an...
Alabama Learning Exchange
Alex: How Long Will It Take?
In this lesson, students will participate in a group activity using a sponge ball and a growing human circle. The students will be added to a circle in groups of two and will pass the sponge ball from hand to hand until it returns to the...
Other
Kindergarten lessons.com: Graphing Activities
Graphing activities for preschool and kindergarten include collecting data and organizing it in a variety of ways. There are lots of fun things to do in this area of math and the activities integrate well with science and literacy...
Physics Classroom
The Physics Classroom: Momentum and Collisions: Collision Carts Activity 1
A virtual collision track with colliding or exploding carts allows students to explore elastic and inelastic collisions. They can vary the mass of the two carts and their pre-collision velocities. An accompanying activity sheet which...
Physics Classroom
The Physics Classroom: Momentum and Collisions: Collision Carts Activity 2
A virtual collision track with colliding or exploding carts allows students to explore elastic and inelastic collisions. They can vary the mass and velocities of the two carts. An accompanying activity sheet which focuses on elastic...


