Curated OER
Weather In The World
Students investigate the weather in different places in the world. In this algebra lesson, students use technology to gain an understanding of how to study integers. They add and subtract integers on a number line.
Curated OER
Collect, organize and compare different data for the Marine Mammals of the Miami Seaquarium, i.e.: size, weight, diet and habitat and how to calculate average, median, mode and range.
Students collect, organize, and compare different data and develop statistical methods such as: average, median, mode and range as a way for decision making by constructing table
Curated OER
Make Your Own "Weather" Map
High schoolers create their own "weather" map using data from x-ray sources. They analyze and discuss why it is important to organize data in a fashion in which is easy to read. They compare and contrast different x-ray sources using a...
Curated OER
Awesome Animals
Students collect data from classmates about their favorite animal. They use the ClarisWorks graphing program to enter data, graph results, and interpret data.
Curated OER
The Bigger they Are . . .
Pupils do a variety of data analyses of real-life basketball statistics from the NBA. They chart and graph rebounding, scoring, shot blocking and steals data which are gathered from the newspaper sports section.
Laboratory for Atmospheric and Space Physics
The Planets and Scale
Scholars gain an insight into the relative size of planets and distance between inner and outer planets with the help of informational text, a data table, and a series of four questions.
Curated OER
Nutrition and Food Security
Examine the three basic nutrients and their effects on the body. Fifth graders will research data to construct a bar graph and then demonstrate the relationship between malnutrition and food security. This is a very comprehensive...
Curated OER
Oh, What A Day
Students listen as the teacher reads A Country Far Away. They predict what they will do and what they think their partner student will be doing. Students create a KWL chart for Japan. They collect information about their activities on an...
Curated OER
Adaptation Investigation - Extreme Beaks
Find photos of bird beaks or show a prepared four slide PowerPoint, "Extreme Beaks" to introduce your class to this special animal adaptation. Provide them with a data table and supplies to try gathering food with tools that each...
Curated OER
Exploration of "Pillbugs"
Fifth graders define vocabulary terms, identify the characteristics of a pillbug, and create a dichotomous key. Then they examine the pillbugs and make observations and record these observations. Finally, 5th graders observe specific...
Curated OER
Changes in Pulse Rate
Eighth graders practice making observations and collecting data after determining a baseline pulse rate then collect data on the changes in that rate with exercise. Students must organize their data and analyze their observations.
Curated OER
Testing the Waters
Eleventh graders examine a local body of water. In this science lesson, 11th graders collect water samples to test. Students analyze the data and make conclusions. Students create tables and graphs of the data.
Curated OER
Using Charts and Graphs to Study East Asia's Modern Economy
Students examine East Asia's modern economy. In groups, classmates use the internet to compare the resources, products, and economy of specified countries. After collecting the data, pupils create charts, tables and graphs. They...
Curated OER
French Fry Run
Student explore estimation and measurement. In this measurement lesson plan, 2nd graders measure french fries, graph their data, and determine the size of french fries that is the best value. Students practice how to add prices and...
Curated OER
Collecting, organizing and comparing data for cellular telephone buying and calculating average, and median price and best deal per cost.
Pupils research data and develop statistical methods such as mean and median price and make convincing arguments as powerful ways for decision making.
Illustrative Mathematics
Electoral College
A cross-curricular resource that takes the electoral votes and allows your learners to organize and analyze the data. Young voters can determine which states are more influential and interpret the dotplot provided for more data....
Curated OER
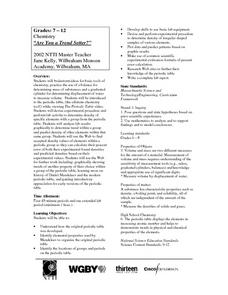
Are You a Trend Setter?
Learners are introduced to the periodic table of elements. They devise and perform and experiment in which they determine the density of specific elements. They use their results to predict the density of other elements in the same group.
Curated OER
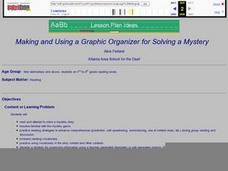
Making and Using a Graphic Organizer for Solving a Mystery
Students create tables in a word processing program which helps them organize their text clues when reading a mystery story. They develop reading comprehension strategies while using a computer based graphic organizer in order to solve...
Curated OER
How's The Weather?
Students make a box and whiskers plot using the TI-73 graphing calculator. Each student would have their own calculator but they would work in small groups of two or three to help each other enter the data and make the plots.
Curated OER
Graphing With Candy
Students gather information and interpret the results using a tally chart, a table, and a bar graph.
Curated OER
Fast Food: You Can Choose!
Learners research the nutritional value of fast food. They assess which fast foods are best and worst to eat. They organize their data into tables and graphs and explain their findings to other students.
Curated OER
Great Tasting Shapes
Fifth graders investigate the concept of median, mode, and range using a simple model for display purposes. They examine different shaped crackers out of a box and identify the ones that occur the most. Then the calculations for the...
Curated OER
Graphing Pendulum Results
Sixth graders set up a pendulum experiment deciding which variable to manipulate (length of string or weight on the string). They create a hypothesis, collect necessary equipment, and write out each step of their experiment. They then...
Curated OER
Old Glory
Learners utilize mathematical concepts such as: measurement, ratio and proportion and geometric probability to analyze the components of the U.S. Flag. They collect, organize and interpret data by constructing charts, tables and graphs...


