Curated OER
Investigation-How Many Toothpicks?
Seventh graders use toothpicks to investigate a series of designs and identify patterns. Data is organized and analyzed using tables and graphs, and students make generalizations using algebraic expressions.
Curated OER
Party, Party, Party
Second graders conduct investigations with counting, comparing, organizing, analyzing, displaying and interpreting data. They pose questions for investigation and collect the data. Students display the data in tally charts, uniform...
Curated OER
Team Apollo
Seventh graders brainstorm about problems with a school track. They research different possibilities for a solution. They test different track materials with erosion, durability, abrasiveness and resiliency. They determine the area,...
Curated OER
Starch and Sugar Testing 1
Eighth graders determine the presence of starch and sugar in unknown solutions. This task assesses students' abilities to observe, record and interpret data, classify, generalize/infer, construct data tables, and identify sugar and...
Curated OER
Frequency Tables
Seventh graders construct frequency tables and box-and-whisker plots. After constructing tables and plots, they take a quiz on mean, median, mode, range, scientific notation, and number properties.
Curated OER
Let's Keep Track of Grades
Students participate in a technology project. This lesson is a hands-on spreadsheet project where students are responsible for keeping track of their grades for class. The students learn to enter data into a spreadsheet, create...
Curated OER
Closing the Case
Fifth graders collect data and prepare data displays using a survey with statistical information.
Curated OER
Just Graph It!
Fourth graders evaluate various graphs for the best way to reflect statistical data. They use a spreadsheet to organize data and generate varied graphic representations. They select the graph they feel best shows their results.
Curated OER
Exploring Probability
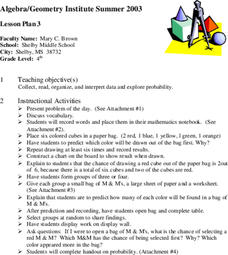
Fourth graders participate in a lesson that explores probability. They use candy and model cubes to experiment with different outcomes that can be charted if the students can proceed to the objective of the lesson. They discover how...
Curated OER
Chew on This
Eighth graders explore and demonstrate the seven steps of the scientific method. They predict how much sugar is in chewing gum and test, analyze, and calculate the sugar content of gum.
Curated OER
Climate Change
Students compare weather data and draw conclusions. In this climate change lesson plan, students determine whether data collected over a period of ninety years shows a warming trend.
Curated OER
Michigan Virtual Field Trip
Students analyze data from a virtual field trip to Michigan. They conduct Internet research on mileage and travel time between cities, calculate and compare fuel costs, and research and calculate lodging, activities, and meal costs.
Curated OER
Statistics with State Names
Students analyze the number of times each letter in the alphabet is used in the names of the states. In this statistics lesson, students create a stem and leaf plot, box and whisker plot and a histogram to analyze their data.
Curated OER
Graphing Favorite Fruit
Third graders take poll and sort data, enter the data to create a spreadsheet and create bar and pie graphs.
Curated OER
Graphing Pasta
Students sort and graph various types of pasta. Using pasta construction paper patterns or real pasta, they sort the pasta by color, size, and type, and record the data on a graph.
Curated OER
Identifying My Spider
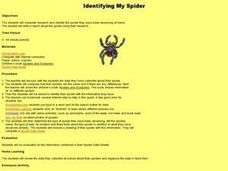
Third graders navigate the Internet and research spiders. In this spider instructional activity, 3rd graders view photos of spiders and use their characteristics to determine the variety of spider. Students complete a spider data sheet.
Curated OER
Using an Amortization Table
Students search the Internet to find a site that contains an amortization table and make a hypothesis about the results of changing time and rate. They examine the affects of time and rate on a mortgage and discuss the difference in the...
Curated OER
The Five Senses
Study various objects and help kindergarteners use their five senses to classify the objects. They are presented with various objects and then use their five senses to sort and classify the objects. Then they use a Visual Ranking Tool to...
Curated OER
Rate of Solution
Eighth graders determine the amount of agitation necessary to dissolve various sized sugar particles. This task assess students' abilities to collect, organize, and interpret data, create appropriate graphs, predict future events based...
Curated OER
Examining Infiltration Rates of Various Soil Types
Students formulate their own hypothesis, determine which variables are important to test their hypothesis, design an experiment in which they collect data. They utilize instruments and tools to measure, calculate, and organize data.
Curated OER
Geoboard Area
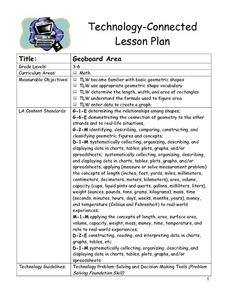
Students explore the basic geometric shapes and geometric shape vocabulary through the use of geoboards and virtual geoboards. They create a variety of shapes with a partner, build ten different rectangles on their geoboards, and...
Curated OER
Discovering the Magical Pi
Learners calculate pi using data on the circumference and diameter of various objects. They define key vocabulary terms, measure the circumference and diameter of various circular objects, organize the data on a table or chart, and...
Curated OER
Fruit Loop Graphing
Fifth graders interpret data and create graphs. Given Fruit Loops, they sort and classify according to color. Using spreadsheet technology, 5th graders record their data and create bar and circle graphs. Students analyze data and...
Curated OER
Creating an Enzyme-Substrate Model
Students explore the reaction rates of an enzyme-mediated reaction through experimentation. In small groups, they use everyday objects to demonstrate the effects of environmental variables on enzyme function.
Students graph and...


