Curated OER
Volume of Gas
Eighth graders investigate the effect of temperature on the volume of a gas in a closed container. They measure the height of the water in their beaker/container, conduct their experiment, and create a graph to illustrate their data.
Curated OER
College Costs are on the Rise
Young scholars examine college costs in different states. In this college cost lesson, students create a table and determine the average cost of college for the states listed. They organize the data into measurement categories. Young...
Curated OER
Mystery Strategy for Elementary Students
Learners of all ages solve historical mysteries. Elementary learners research historical topics by organizing information presented by their instructor, formulating hypotheses, and considering solutions to mysteries presented about...
Curated OER
Bird Feeding and Migration Observation
Students research bird migration and build a bird house. In this bird lesson plan, students research the birds in their area and where they migrate to. They also build their own bird house and record data on what kinds of birds come to...
Curated OER
Atlatl Lessons for Grade 4
Fourth graders explore the weapons of the Aboriginal people. In this fourth grade math lesson, 4th graders create charts, tables, or diagrams to represent patterns and relations. Students investigate which dart length has the best...
Curated OER
I'm in the Money - Practical Money Skills
Students make a budget and utilize math skills to keep a record of what they spend. They use technology and spreadsheets to help them keep track of their money.
Curated OER
Graph and Compare the Adventure's Temperature Vs. Local Temperature
Students explore the concept graphing data. In this graphing data lesson, students use weather data from their local weather and some other city and graph them. Students plot the local weather vs. another city. Students record...
Curated OER
Speed + Graphing = Winners!
Fifth graders take addition timed tests every day for a two week period. Using the data from the timed tests, they create a bar graph using Microsoft Excel computer software, a personal bar graph using graph paper and colored pencils,...
Curated OER
Tall Tale Rollers
Students explore American tall tales. In this tall tale lesson, students discover the six characteristics that are included in tall tales. Students survey their class to find each student's favorite tall tale character and organize the...
Curated OER
One, Two, Three...and They're Off
Students make origami frogs to race. After the race they measure the distance raced, collect the data, enter it into a chart. They then find the mean, median, and mode of the data. Next, students enter this data into Excel at which time...
Curated OER
Banquet Menu Assessment: Exposure Investigation Exercise
Learners identify sources of Food Borne illness and their prevention. They formulate hypotheses based on collected information. Pupils become aware of Nutrintional value of food. Students collected data are synthesized to formulate...
Curated OER
Count The Letters
Students perform activities involving ratios, proportions and percents. Given a newspaper article, groups of students count the number of letters in a given area. They use calculators and data collected to construct a pie chart and bar...
Curated OER
Range, Mean, Median and Mode Through the Internet
Middle schoolers compute measures of central tendency. In this range, mean, median and mode lesson, students gather information on the internet, organize the data and then compute the measures of central tendency. They create a...
Curated OER
Log Book Guidelines
High schoolers are given the guidelines for their log books. The log book first starts with what is the purpose of a log book. Then students have the instructions on how to organize a log book. From there student are given step by...
Curated OER
Projectile Motion
Students observe projectile motion and calculate the speed of a baseball based on the time and distance traveled. They record the time, measure the distance, and draw the path of the ball's travel on a data table.
Curated OER
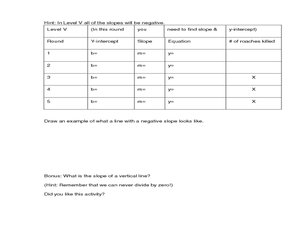
Cockroach Slope
Students identify the slope of linear functions. In this slope lesson, students collect data and graph it. They write equations with no more than two variables and use technology to explain their data.
Curated OER
E3 Project
Learners investigate excited electrons. In this chemistry lesson plan, students will go through a series of activities designed to help them understand how excited electrons emit different colors of light.
Curated OER
Genetic Variations in Hand Span Size
Students study genes. In this biology lesson plan, students measure their handspan size to determine if one pair or many pairs of genes control that trait.
Curated OER
Community Wellness Fair
Twelfth graders list ideas to create a wellness fair. They form student committees to organize times for each class to participate in the fair. Students assist in setting up the fair by putting up tables for the exhibitors, preparing...
Curated OER
Sound Busters
Fourth graders engage in a study of sound pollution at their school. After a class discussion on what noise pollution is, learners are asked if they think there are areas of their school or community where noise pollution is a problem....
EngageNY
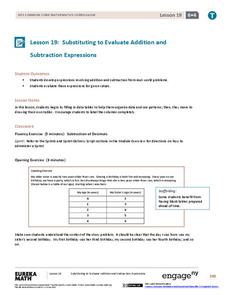
Substituting to Evaluate Addition and Subtraction Expressions
Substitute this resource for what you used to use. Learners identify patterns in data tables and write addition and subtraction expressions to represent relationships. Substitution allows them to solve problems in context in the 20th...
Curated OER
Finding the Percent of a Number in Fish Body Weight
Students use fractions to find the weight of fish. They use percentages to determine the correct amount to feed them. They organize their data into a graph and shares with the class.
Curated OER
Graphing Made Easy
Fourth graders discover the appropriate way to construct and analyze bar, line, picto, and circle graphs. They set up frequency tables and perform some statistical analysis (mean, median, and mode) on their data.
Curated OER
A Day at the Beach
Student read Sheryl Wilson's story, "A Day at the Beach" while classifying items they find. They design a chart of the items before using educational graphing software to create a graph.


