Polar Trec
Ozone Data Comparison over the South Pole
Did you know the hole in the ozone is seasonal and filled by January every year? The lesson uses scientific measurements of the ozone over the South Pole to understand patterns. Scholars learn that the hole grew bigger annually before...
Curated OER
Identifying Ozone Variations over Different Locations
Students analyze ozone data. In this atmosphere lesson, students will use a NASA resource to gather data for different regions of the Earth. Students will then create a graph for their data and answer related questions.
Curated OER
Ozone: The Earth's Security Blanket
Learners work in groups to define and research the terms: ozone, troposphere and stratosphere. Students watch videos, conduct Internet research, participate in discussion groups and complete worksheets.
Curated OER
Environment: Battling for Oxygen
Learners construct an interactive ozone depletion model using gumdrops and toothpicks. After analyzing the data obtained from the model, they record it on butcher paper and complete worksheets about oxygen.
Curated OER
Graphing Ozone Chemistry: Introduction
Learners discuss Ozone Chemistry. They do research on the subject. They graph their data. They analyze the economic impact of removing CFC's from the biosphere, and graph the worldwide production of CFC's since their discovery.
Curated OER
Ozone and Temperature Data Analysis, South Pole Antarctica
High schoolers discuss the layers of the atmosphere, and the history of the ozone hole. They discuss the chemistry of the ozone formation. Students compare seasonal data collected with ozonesondes. They compare Antarctic and Arctic ozone...
Curated OER
Ozone
Students locate the ozone layer of the atmosphere. They explain natural formation of ozone. They list chemicals that react with ozone. They explain how CFC's destroy ozone.
Curated OER
Global Warming Statistics
Students research real-time and historic temperature data of U.S. and world locations, and analyze the data using mean, median, and mode averages. They graph the data and draw conclusions by analyzing the data. A spreadsheet is used to...
Curated OER
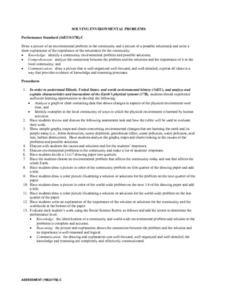
Solving Environmental Problems
Learners identify a community environmental problem and possible solutions. They analyze the connection between the problem and the solutions and the importance of it to the local community. Students then draw a picture of an...
Curated OER
Transportation Choices and the Environment
Middle schoolers study statistics and charts pertaining to how transportation and other energy choices impact the environment. They participate in small group discussions regarding concerns for the future.
University of California
Graphing Stratospheric Ozone
A lesson plan that will help teachers learn more about ozone and guide young scholars in a graphing stratospheric ozone. The lesson plan includes four parts, an introduction, links to ozone chemistry and two links for graphing activities.


