Curated OER
Data Handling
In this data handling worksheet, 6th graders solve and complete 4 various types of problems. First, they draw a bar chart to represent the information provided in the table shown. Then, students show beneath the table how to work out the...
Curated OER
Graph a Panther's Diet
Students examine the diet of panthers. In this interpreting data lesson, students collect data on the panther's diet and chart the data in bar and pie graphs.
Curated OER
BUS: Farming: It's A Fact (Ag)
Pupils create two different types of graphs from the information in the "Farm Facts" booklet (i.e., bar graph, pie chart, etc.). They calculate where your food dollars are spent (on and off farm).
Curated OER
Bubble Art
Students add color to the bubbles. In this art lesson, students lightly blow the bubbles onto the paper and then the paper dries. Students enjoy making an easy art project.
Curated OER
Pepper Shamrock Prints
Students print paper using green paint. In this art lesson, students dip open halves of bell peppers in green paint and make prints that resemble shamrocks. Students use their imagination and decorate the paper for St. Patrick's Day.
Curated OER
EASY AS PUMPKIN PIE
Students demonstrate place values using pumpkin seeds as a math manipulative. They use manipulatives, models, known facts, properties and relationships to explain thinking processes. They estimate the number of seeds in their pumpkin.
Curated OER
Dancing Paper: Static Charge, Science
Students use glass, plastic, paper and various other materials to investigate the properties of static charge and develop scientific inquiry skills.
US Apple Association
Apples: A Class Act! (Grades 4–6)
Middle schoolers have a bushel of fun as they engage in activities and research core facts about apples. Packed with suggestions for in-class activities and out-of-class research, the colorful 6-page packet is sure to satisfy hungry...
Curated OER
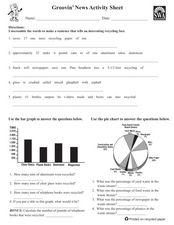
Groovin' News Activity Sheet
In these recycling worksheets, students complete several activities to learn about recycling. Students complete a word search, word scramble, bar graph, pie chart, research project, class project, and individual project for recycling.
Curated OER
Heart Mobiles
A variation on classic Valentine's Day lessons that is sure to please, your elementary class construct heart mobiles using construction paper, string or yarn, hole punchers, foil, and pencils.
Curated OER
"Pi" Day
Your class will complete research dealing with Pi and its value in mathematics, leading into a discovery lab to demonstrate Pi, how it is determined, and how it is used. In the end, students eat PIE!
California Academy of Science
Fraction Penguin
Exploring mathematics through art is a fun and concrete way to help learners grasp a concept. They will construct a paper penguin using fractions cut from circles. They'll need to determine 1/8, 1/4, and 1/2 of each circle. Once the...
Curated OER
Creating Circle Graphs with Microsoft Excel
Seventh graders will learn how to construct circle graphs using paper and pencil. Then they will learn how to construct circle graphs using Microsoft Excel. This lesson plan uses technology and shows learners how to cross skills into the...
Curated OER
It's Raining Cats and Dogs
Make a beeline to this activity. Prepare paper strips with the provided idioms to engage teams in illustrating their literal meanings. The drawings provide the impetus for a guessing game where class members compete to be the first to...
Curated OER
Turning Tomato
Did you know that tomatoes are the world’s most popular fruit? Did you know that tomatoes are related to the deadly nightshade plant? Using red plates and brads, your researchers record tomato facts on a pie chart and create a Turning...
Curated OER
Equivalent Fraction Munch with Pizza Pie
Students demonstrate fractions and mixed numbers using concrete pictorial models of pizza. They relate symbols to the models.
Illinois Valley Community College
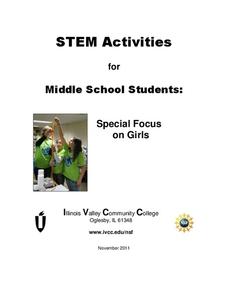
STEM Activities for Middle School Students
Use STEM activities within the class to provide connections to concepts. The resource includes activities that range from working with buoyancy to building rockets and launching them. Other activities involve the engineering design...
Virginia Department of Education
Graphs
Examine different types of graphs as a means for analyzing data. Math scholars identify the type of graph from a series of data displays and then develop questions to match each one. Then, given a scatter plot of height versus age...
Bowland
Mystery Tours – Plan Your Tour
Everyone loves a vacation and a set of three activities has groups planning a tour of the U.K. using given distance, time, and price data. They solve a variety of problems related to the trip and produce a report on the success of...
Curated OER
A Picture is Worth a Thousand Words: Introduction to Graphing
Students practice graphing activities. In this graphing lesson, students discuss ways to collect data and complete survey activities. Students visit a table and graphs website and then a create a graph website to practice graphing.
Curated OER
Trash Pizza
Students identify items commonly sent to landfills and summarize percentages/fractions of different items in landfills Students create a pizza pie graph of landfill components
Curated OER
Valentine Hat
Students create a valentine hat out of red construction paper and a paper towel tube. In this art lesson, students create a hat out of strips of red construction paper attached to the paper towel tube. Students glue hearts on the hat as...
Curated OER
Mother's Day Butterfly and Poem
Students make butterflies out of paint and an open hand. In this art lesson, students press an open hand with paint on paper spreading the fingers to represent wings.
Curated OER
Pizza Party
Young scholars explore the concept of fractions through use of hands on activity. In this lesson about fractions, students will work together in small groups with a round piece of paper, or pizza, and cut the pizza into pieces. Young...


