Curated OER
Physical Habitat of a Stream
Students measure in metric units and use a stopwatch, calculator. They collect data with minimal instructions after the initial pre-activity briefing, then record data in the data sheets provided.
Curated OER
Thinking About Learning
Learners discuss and read about approaches to classroom learning. They write a paper comparing the educational philosophy of CALS with that of their own schools. Specific examples are crucial to a successful piece.
Curated OER
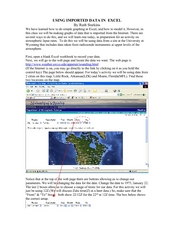
Using Imported Data in Excel
Students import atmospheric data from the internet. In this earth science lesson, students graph the data they collected. They complete the worksheet after the activity.
Curated OER
Curveball vs. Fastball
Students graph the relationship between the release point and the final position of curveballs and fastballs thrown by both right and left handers given a constant speed, and explain the relationships illustrated by the graphs of data.
Curated OER
Lift vs. Airspeed
Young scholars, after reading the explanation given below, use FoilSim and a graphing calculator to complete the activity to determine the relationship between airspeed and lift of an object by interpreting data.
Curated OER
Wind Gauges
Young scholars use FoilSim interactive software to become familiar with the way in which the flow of air across or around an airfoil affects its ability to create lift.
Curated OER
Did You Catch My Drift?
Students, through the use of the Curveball interactive software package, become familiar with the way in which the flow of air across or around an object affects its ability to lift, spin, and curve. After reading the explanation given...
Curated OER
Wing Shapes and Areas
Students, after reading the explanation given below, use FoilSim to determine the weight of the aircraft that can be lifted by a pair of wings of each type. They also design a unique platform of a wing to lift a plane weighing 11500 pounds.
Curated OER
Using Graphs to Compare
Students use the FoilSim computer simulation program, and demonstrate an understanding of the lift variables by explaining their graphical representations. They demonstrate an understanding of forces and motion.
Curated OER
Design of Airfoils and Problem- Solving Using FoilSim
Ninth graders, after reading the explanation given below, complete the problem-solving activities to demonstrate an understanding of the concepts presented.
Curated OER
Characteristics of Lift and Wing Area
Students use FoilSim to complete the activity and investigate the factors that affect lift and how wing area and lift are related.
Curated OER
Showing the Lift Equation
Learners read an explanation from a NASA Web-based textbook, then demonstrate an understanding of the text by using it, along with FoilSim, to complete an activity that manipulates the lift coefficient equation.
Curated OER
Using 3-D Models for Code Validation with FoilSim
Students use FoilSim to complete the activity to create tables of data sets comparing the lift values for a 3-D model of a symmetrical wing section to the values predicted by the FoilSim software.
Curated OER
Wing Specifications
Ninth graders use FoilSim to fulfill the specifications of a given airfoil (wing) and plot and interpret graphs.
Curated OER
Lift Equation Problem Set
Pupils, after reading an explanation from a NASA Web-based textbook, demonstrate an understanding of the text by using it, along with FoilSim, to complete an activity to graph and interpret the lift equation.
Curated OER
Wing Area Effects Problem Set
High schoolers read an explanation from a NASA Web-based textbook on lift and an explanation on the FoilSim software package given below. They use FoilSim to evaluate the relationship between wing area and lift.
Curated OER
Velocity Effects Problem Set
Students, after reading an explanation on lift from a NASA Web-based textbook and an explanation on the FoilSim software package given below, use FoilSim to evaluate the relationship between velocity and lift.
Curated OER
Rotation Sensor Challenge
Students participate in a challenge to construct a rotation sensor with the highest degree of accuracy and repeatability. They conduct computer analysis of their sensor using repeated trial.
Curated OER
Water: On the Surface and in the Ground
Students explore the differences between surface water and ground water. They collect data using maps and graphs and investigate a Texas river basin and a nearby aquifer. They complete a written report including maps and data regarding...
Curated OER
Water-Is There Going to be Enough?
High schoolers research the availability, usage and demand for water in the local area historically and use projections of the availability, usage and demand for water up to the year 2050. They gather data and present the information in...
Curated OER
Mass & Velocity Effect
Students, after reading the explanation given below, use FoilSim to complete the activity to fulfill the specifications of a given airfoil and then plot and interpret graphs.
Curated OER
Lesson Plan 2--3000 B.C. to 2000 A.D.?
Students, in groups, study the different writing systems from 3000 B.C. to 2000 A.D.
Curated OER
Central Tendencies and Normal Distribution Curve
Fourth graders are given data (class test scores) to determine central tendencies, and find information needed to construct a normal distribution curve. They become proficient in calculating mode, median and average.
Curated OER
Pyrotechnics
Students discuss pyrotechnics and what they have noticed about their height and speed. They think about the path which fireworks follow which is a parabola. They follow multiplication patterns to determine the Zero Product Property and...


