Curated OER
Graph Dynamic Linear Equations
Students explore the concept of linear equations. In this linear equation lesson, students change parameters of an equation and notice the effect it has on its graph.
Curated OER
Graph Figures From Equations
Students explore the concept of graphing figures from equations. In this graphing lesson, students use Microsoft Math to graph figures from equations and write equations from graphed figures.
Curated OER
Introduction to Parametric Equations
Students write and solve parametric equations. In this algebra lesson, students find and eliminate parameter of equations. They graph parametric equations and analyze the graphs.
Curated OER
Watts Up Doc?
Students examine the wattage of a light bulb using math. In this algebra lesson, students find the inverse square of given parameter. They work in groups collecting and analyzing data.
Curated OER
Algebra II: Exponential Functions
High schoolers investigate, describe, and predict the effects of parameter changes on the graphs of exponential functions; describe limitations on the domains and ranges of these functions; and examine asymptotic behavior.
Curated OER
Sinusoidal modelling of Canad'a youth cohorts
Students explore the general form of the sine equation. In this trigonometry instructional activity, students explore the relationship between the changing parameters and the graph of the sine equation. Students use data and a...
Curated OER
Trigonometric Transformations
Students perform transformation on trig functions. In this precalculus lesson, students relate the London Eye observation wheel to trig function. They use a TI navigator to visualise the parameter created by this view and relate it to...
Curated OER
Getting it Right!
Students investigate error. As shown in earlier activities from navigation lessons 1 through 3, without an understanding of how errors can affect position, one cannot navigate well. Students explore how computers can help in navigation....
Curated OER
Standard Linear Form
Ninth graders identify and describe the x-intercept as the place where the line crosses the x-axis as it applies to football. They create their own differentiations to reinforce the distinction between the x-intercept and the...
Curated OER
Putting Your Money to Work
Students create a collect data on expenses. In this algebra lesson plan, students create a spreadsheet to solve scientific equations. They incorporate math, science and technology in this lesson plan.
Curated OER
Scatterplots and Regressions
In this scatterplots and regressions worksheet, students solve 6 different types of problems related to graphing scatterplots and interpreting regressions. First, they create a scatterplot from the given data coordinates and then,...
Curated OER
Worksheet 9 - Functions
In this function worksheet, students explain continuous and noncontinuous function and graph derivatives. This two-page worksheet contains seven multi-step problems.
Curated OER
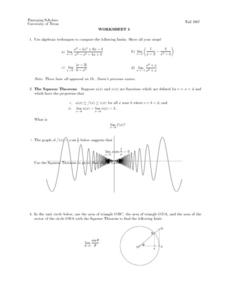
Worksheet 5 - Squeeze Theorem
In this Squeeze Theorem worksheet, students compute limits, identify a graph that represents the Squeeze Theorem, and graph given functions. This two-page worksheet contains seven multi-step problems.
Curated OER
Length of an Arc
Students compute the length of an arc and each hypotenuse in the give figure, adding them up in the end. They then develop the formula for the arc length with respect to the x-axis and the y-axis. Students also develop a formula for the...
Curated OER
Mobile vs. Money
Students research the internet and use the information they find to plot straight line graphs. They use graphs to make comparisons of the various packages offered. Students interpret graphs and solve problems based on varying parameters.
Curated OER
The A.H.S.M.E.
In this secondary mathematics worksheet, students determine all the parameters by which a student could score 112 points on the American High School Mathematics Examinations. The one page worksheet contains one problem with solution.
Curated OER
The Multiplying Digits Problem
In this digits problem, students determine what digits, when multiplied, equal given parameters. This one-page instructional activity contains 1 problem. The answer is provided at the bottom of the page.
Curated OER
Math: Checking Scale Drawings for Accuracy
Students critique their own drawings for accuracy and make constructive suggestions prior to reworking them. They discover how scale in maps and drawing relate to relative size and distance. In addition, students comprehend the...
College Board
Power in Tests of Significance
Test your knowledge of tests of significance. A curriculum model for AP® Statistics describes and defines power in terms of tests of significance. It also provides two classroom activities designed to investigate power and how it relates...
Agile Mind
Rabbit populations
In this real-world problem about the rapid growth of rabbit populations, students must analyze two different scenarios and create mathematical models to represent them. They use their exponential models to answer questions about the...
EngageNY
Vectors and the Equation of a Line
Represent linear equations in both two and three dimensions using parametric equations. Learners write parametric equations for linear equations in both two and three variables. They graph and convert the parametric equations to...
Shodor Education Foundation
InteGreat
Hands-on investigation of Riemann sums becomes possible without intensive arithmetic gymnastics with this interactive lesson plan. Learners manipulate online graphing tools to develop and test theories about right, left, and midpoint...
Statistics Education Web
Text Messaging is Time Consuming! What Gives?
The more you text, the less you study. Have classes test this hypothesis or another question related to text messages. Using real data, learners use technology to create a scatter plot and calculate a regression line. They create a dot...
Statistics Education Web
Consuming Cola
Caffeine affects your heart rate — or does it? Learners study experimental design while conducting their own experiment. They collect heart rate data after drinking a caffeinated beverage, create a box plot, and draw conclusions. They...


