EngageNY
Modeling from a Sequence
Building upon previous knowledge of sequences, collaborative pairs analyze sequences to determine the type and to make predictions of future terms. The exercises build through arithmetic and geometric sequences before introducing...
Curated OER
Worksheet 9 - Functions
In this function worksheet, students explain continuous and noncontinuous function and graph derivatives. This two-page worksheet contains seven multi-step problems.
Curated OER
Exploring the Normal Curve Family
Students find different characteristics of the bell curve. In this statistics lesson, students analyze a family for a specific characteristic. They identify the shape, center, spread and area as they analyze the characteristic of the...
Illustrative Mathematics
The Missing Coefficient
This activity highlights the use of the remainder theorem to solve for the unknown coefficient of a specified polynomial when given one of its factors. Use this single problem as a warm-up exercise, a quick check-in at the end of a...
Curated OER
Cartesian Geometry
In this geometry worksheet, students plot coordinate pairs and connect the points to create different shapes. They give th shapes its polygon's name. They differentiate between simple functions and rectangular hyperbola.
Curated OER
WINDMILL POWER
Learners study operations with real numbers using mental computation or paper-and-pencil calculations. They judge the reasonableness of numerical computations and their results. They set up and solve proportions for direct and inverse...
Curated OER
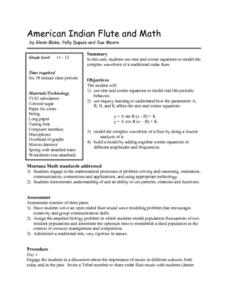
American Indian Flute and Math
Students investigate the Math behind Musical instruments in this cross-curricular Math lesson on the Native American Flute and waveforms. The lesson can be accomplished in 6 days and includes an extensive materials list for successful...
Curated OER
Performance-based Assessments for Network Analysis Competencies
In this electrical circuit quiz, students use schematics to answer a series of 7 open-ended performance based questions to show their understanding of Thevenin's and Norton's theorem about electrical circuits. This quiz can be printed...
Curated OER
Elementary Amplifier Theory
In this amplifier learning exercise, students answer ten questions about amplifiers, their voltage gain, current gain and power gain. They analyze class-B transistor amplifiers and class-A transistor amplifiers.
Curated OER
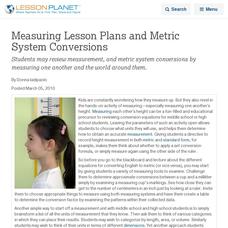
Measuring Lesson Plans and Metric System Conversions
Students may review measurement, and metric system conversions by measuring one another and the world around them.
Curated OER
How Texas is Planning To Manage Its Water
Students research water management strategies in Texas. They analyze projected demand for water in the year 2050, interpret graphs and tables and then discuss the data as part of a written report. They research and map the locations of...
Curated OER
The Effects of Light Intensity and Wavelength on the Rate of Photosynthesis
Students use an on line website to simulate the effects of light intensity and wavelength on photosynthesis. In this photosynthesis lesson plan, students determine how wavelength of light and intensity of light affect the rate at which...
Curated OER
Modeling With Quadratics
Young scholars investigate quadratics through word problems. In this algebra lesson, students models the number of registered males in apprenticeship programs. They investigate the transformation of quadratic function on a coordinate plane.
Curated OER
Linear Graphs and Patterns
Fifth graders find pairs of whole number co-ordinates and use them to draw graphs in problem contexts. They find and interpret the all meaningful pairs of whole number co-ordinates from graphs.
Curated OER
Using Concept Maps to Design 3D Spheres
High schoolers create three dimensional shapes using concept maps. In this geometry lesson, students investigate the impact of mental schemas on humans. They collect data on this topic and plot their data on a coordinate plane.
Curated OER
Math: Will The Airplane Get Off the Ground?
Students use data from real-life models to calculate and compare the force required for an airplane of a given weight to become airborne. They use a graphing calculator to evaluate data and use the World Wide Web to access data.
Curated OER
Numerical Analysis/ Examples of Round Off Errors
In this math worksheet, students practice computing the errors for rounding off and use the skill of analysis to find the true solutions.
Curated OER
Power Metering Project
High schoolers collect and analyze variable data and understand the concept of electrical power. In this energy lesson students use a spreadsheet to manage their data and create box plots.
Curated OER
Water in the Texas Coastal Basins
Students, after researching a Texas coastal basin, map and graph the information they collect and then translate it into a short report to be presented to their classmates. They brainstorm unique ways to maintain Texas estuaries as well...
Curated OER
Worksheet 21 Spring 1996
In this math worksheet, students consider a path around the unit circle parameterized by σ on the interval [0, 1] with σ(t) = sin(5πt − π), cos(5πt − π). Then they find the vector.
Curated OER
The Old Chicken Run Problem
Sixth graders apply problem solving strategies to work with a real life situation in which they need to determine the area. They determine the area of chicken runs that are rectangular in shape when give a partial perimeter.
Curated OER
Parabola
Students complete a worksheet and explore the parabola conic section during a web based activitiy. They answer questions based on their work as they make changes in the features of the parabola.
Curated OER
Altitude and Flight Forces
Students use the World Wide Web to access and use FoilSim. They also use the World Wide Web to access the NASA Glenn Web site for information relative to the factors involved with the flight of an airplane.
Curated OER
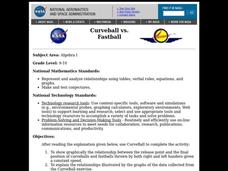
Curveball vs. Fastball
Students graph the relationship between the release point and the final position of curveballs and fastballs thrown by both right and left handers given a constant speed, and explain the relationships illustrated by the graphs of data.


