Curated OER
Timed Multiplication Test Graphs
Students use the tools of data analysis for managing information. They solve problems by generating, collecting, organizing, displaying histograms on bar graphs, circle graphs, line graphs, pictographs and charts. Students determine...
Curated OER
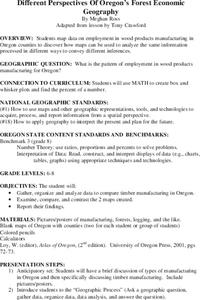
Different Perspectives of Oregon's Forest Economic Geography
Students locate the many forests located in Oregon. In groups, they use the internet to research employment data on wood products made in the state. They discuss how looking at information presented in a different way can change their...
Curated OER
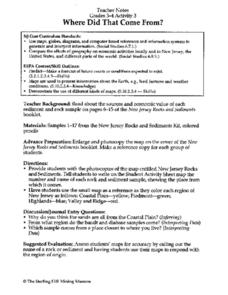
Where Did That Come From?
Fourth graders participate in a scavenger hunt. They locate specified items, finding the country origin. Students collect and organize the data, marking each country on a map. After researching the results, 4th graders write an analysis...
Curated OER
Highs and Lows
Students use email to chart weather patterns and then graph their findings. In this weather patterns lesson, students chart their weather for a week at the school. Students then use email to find temperatures at a variety of locations....
Curated OER
Pepe Cleaners
Seventh graders gather data to determine the relationships between the base and height of rectangles with fixed perimeters and express the relationships using words and symbols. Students build rectangles with pipe cleaners. They create...
Curated OER
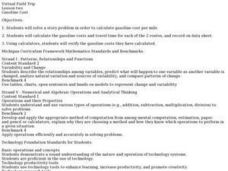
Virtual Field Trip/ Gasoline Cost
Young scholars complete a word problem to determine the cost of gasoline per mile of their virtual field trip. They determine the travel time and gasoline costs for two routes and record the information on a data sheet. They check their...
Curated OER
Teaching about Diel Temperature Variation
Learners explore temperature variation in lakes and deal with the data.
Curated OER
Streamflow
Learners discuss the topic of streamflow and how it occurs. They take measurements and analyze them. They interpret data and create their own charts and graphs.
Curated OER
Dream Car Math
Students collect car cost comparison data from the "Car Wizard" web site to use as problem solving and for calculations related to math.
Curated OER
Surveying During a Basketball Game
Tenth graders conduct a survey at a high school basketball game. They compile and present the data as histograms or bar graphs.
Curated OER
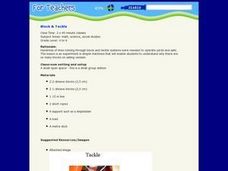
Block & Tackle
Students participate in a lab experiment in which they discover the need for so many blocks and tackles on sailing ships. In groups, they make and test their predictions and practice measuring objects in various units. They record and...
Curated OER
A Canadian Inventory: The Way We Are!
Students use the Canadian Atlas to discover an inventory of Canada's wealth and usage of resources. Using charts and graphs, they produce a wall of selected data of importance to the country and identify one issue of sustainability. ...
Curated OER
Traffic Watch with a Palm
Students, in groups, interpret data about traffic using Palm technology.
Curated OER
Rhinos and M&M's
Students analyze patterns of exponential models by collecting data in paper folding and M&M investigations. They use graphing calculators to create scatter plots that lead to equations for the exponential models. They then apply this...
Curated OER
Microclimates of Our School
Students read the story "Weslandia" by Paul Fleischman, define the term microclimate, gather and record data in various places on school grounds to establish the presence of difference microclimates, analyze and compare microclimates,...
Curated OER
SEVERE WEATHER UNIT
Students conduct research on specific severe weather patterns of interest and collect data to be shared with other students on these phenomona. They write (or review) a severe weather action plan for the school and presents their findings.
Curated OER
Linear Equations
Students discover the equation of a line. They accurately record data collected from the game, "You're On A Roll", create number sentences by rolling dice, and choose their own values for the multiplication and addition steps.
Curated OER
Transformation, Reflections, Rotations and Translations
Students create a quilt, using different patterns. For this geometry lesson, students apply prior knowledge as they use different patterns to help them create a quilt using transformations and geometric shapes.
Curated OER
Calculating Profits from Selling Virtual Lemonade
Students set up and collect data for a virtual lemonade stand. In this entrepreneurship, economics, and technology lesson, students purchase ingredients, determine costs, and set up a virtual lemonade stand. Students consider weather...
Curated OER
Does One Tree a Forest Make?
Students take a walk around the schoolyard looking at and identifying the trees. One leaf for each tree is collected. A chart is developed that represents the population of trees on the school ground. They keep journals and write an essay.
Curated OER
Poetic Math Greeting Cards
Fourth graders work in groups; collect data in a survey; depict in tables, charts, or graphs the results of the survey; and make predictions. They use creative writing skills and computer skills to generate a greeting card of their own.
Curated OER
Hunt for the Serial Arsonist
Students prepare study, and graph fingerprint patterns. They create latent fingerprints and look for common features in their prints for classification.In addition, they create a graph showing the distribution of different patterns...
Curated OER
Conducting a Scientific Investigation
Students investigate a possible health problem in the local school district through inquiry into attendance records, activities, maps, graphs, and data tables. The simulation continues as solutions for the problem are sought.
Curated OER
Eatem Up!
Students identify, interpret and demonstrate a positive learning attitude. They identify, comprehend and use basic concepts and skills and then, communicate clearly in oral, artistic, written, and nonverbal form. Students also identify...


