Curated OER
Is Global Warming Happening?
Students investigate the probability of global warming and the effects of global warming on the environment. They conduct Internet research and collect data, transfer the data onto an Excel spreadsheet, and create a presentation that...
Curated OER
Analyzing Tree Rings to Determine Climate Change
Students examine how to locate and access data sets. In this climate change instructional activity students import data into Excel and graph it.
Science 4 Inquiry
Snakes in the Everglades
The Burmese python is on the loose ... and he's hungry! Illustrate the differences between causative and correlative relationships through an inquiry instructional activity. Pupils examine several sources of information to determine if...
Curated OER
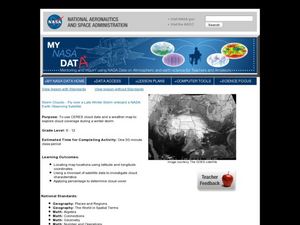
Storm Clouds-- Fly over a Late Winter Storm onboard a NASA Earth Observing Satellite
Students study cloud data and weather maps to explore cloud activity. In this cloud data lesson students locate latitude and longitude coordinates and determine cloud cover percentages.
Curated OER
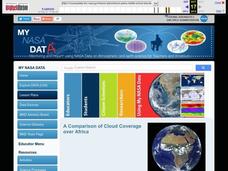
A Comparison of Cloud Coverage over Africa
Young scholars identify different climate regions and local weather patterns. For this cloud coverage lesson students use NASA satellite data and import it into Excel.
Curated OER
Weather "Whys"
Students complete activities to explore fall weather. In this weather lesson, students use the given links to examine weather forecasts. Students complete a weather graph activity and watch Internet field trips. Students complete fall...
Curated OER
Weaving Weather Maps with the World Wide Web
Learners access the Internet and use real time data from the American Meteorological Society to create a detailed weather map. They make weather predictions based on the data collected.
Curated OER
The Global Precipitation Measurement Mission (GPM) Lesson
Introduce your class to one of the ways that technology is benefiting humanity. The Global Precipitation Measurement Mission involves the data collected by nine satellites from different countries with a united focus on studying world...
EngageNY
Graphs of Exponential Functions
What does an exponential pattern look like in real life? After viewing a video of the population growth of bacteria, learners use the real-life scenario to collect data and graph the result. Their conclusion should be a new type of graph...
Curated OER
Design Patterns in Everyday Life
Students find symbols and patterns in everyday life. In this patterns lesson, students break into groups and look for specific patterns and symbols. Students record their findings. Students create a graphic organizer with the information.
Curated OER
Walking on Air
Pupils collect and analyze data with a graph. In this statistics instructional activity, students use central tendencies to find the meaning of their data. They display the data on a Ti calculator.
Curated OER
FILLING IN THE GAPS - Acquiring and Analyzing Satellite and Ground-Based Data
Students monitor rainfall, compute daily averages, and compare their methods of computation to those used by actual researchers using satellite observations.
Curated OER
TI-Nspire Activity: What Does Your Representation Tell You?
By learning to select the best representation for three meal plans, students compare three meal plans to determine the best choice. Data for the meal plans is sorted on a table, as an algebraic equation, and graphed on a coordinate grid....
Howard Hughes Medical Institute
Survival of the Fittest - Variations in the Clam Species Clamys sweetus
It's not often that you come across a clever laboratory activity that is both imaginative and comprehensive! Using M&M's and Reese's peanut butter candies to represent two different clam species, young biologists test for "relative...
Curated OER
Graphing Family Reading Habits
Second graders collect data from their families about their reading habits and graph them. In this graphing family reading habits instructional activity, 2nd graders interview family members about their reading habits. They then use a...
Curated OER
Weather Patterns
Fourth graders collect and chart weather data over the course of the school year either using tools at school or media resources. They agree on weather terms to use in their observations and write them on the assigned sheet. Finally,...
Curated OER
Squares in the Light
Students collect and analyze data using a graph. In this algebra lesson, students explain their findings orally and with a graph. They use their knowledge to solve real life scenarios.
Curated OER
Climate Patterns across the United States
High schoolers articulate differences between climate and weather using examples in a written statement. Using climate data from across the country, they describe climate patterns for various parts of the United States on a map. Students...
Curated OER
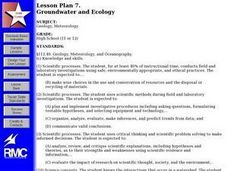
Groundwater and Ecology
Students are presented a problem concerning an aquifer which may be in danger from overuse by agriculture/industry. They compile data and consult online data and experts in creating a proposal to rectify the situation.
Curated OER
That's Predictable - Stream Side Science
Research the impact that changes in biotic or abiotic factors might have on an ecosystem. Debate for or against the changes and take action in the community. This resource ideally follows stream studies that young ecologists may have...
NOAA
A Quest for Anomalies
Sometimes scientists learn more from unexpected findings than from routine analysis! Junior oceanographers dive deep to explore hydrothermal vent communities in the fourth lesson in a series of five. Scholars examine data and look for...
Curated OER
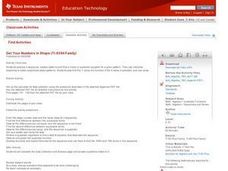
Get Your Numbers in Shape - TI-83
High Schoolers use the TI-83 calculator to produce a sequence, explore patterns and find a linear or quadratic equation for a given pattern. They use inductive reasoning to make conjectures about patterns. They find the Y-value of a...
Curated OER
Creating a Graph
Students brainstorm favorite things to do during the summer. They survey classmates to collect data, arrange it in a chart, and create graphs using ClarisWorks.
Curated OER
Survey Project
Eighth graders create a website using FrontPage. They use inserted forms to collect survey information and use Microsoft Excel and MS Word to create a presentation of the survey and the results.


