Curated OER
Graph and Compare the Adventure's Temperature Vs. Local Temperature
Students explore the concept graphing data. In this graphing data lesson, students use weather data from their local weather and some other city and graph them. Students plot the local weather vs. another city. Students record...
Curated OER
Michigan Virtual Field Trip
Students analyze data from a virtual field trip to Michigan. They conduct Internet research on mileage and travel time between cities, calculate and compare fuel costs, and research and calculate lodging, activities, and meal costs.
Curated OER
Temperature High and Lows
Students gather high and low temperature readings through email. In this temperature graphing lesson, students use a spreadsheet to input data for a graph. students interpret the graphs to compare and contrast the data from different...
Curated OER
Feeling the Heat
Students investigate the urban heat island effect. In this urban heat island effect lesson, students learn how trees, grass, asphalt, and other things on the school grounds effect temperature. They use the information to generalize it to...
Curated OER
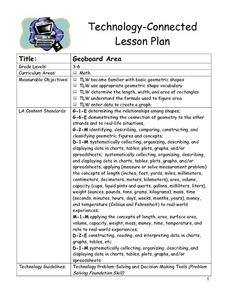
Geoboard Area
Students explore the basic geometric shapes and geometric shape vocabulary through the use of geoboards and virtual geoboards. They create a variety of shapes with a partner, build ten different rectangles on their geoboards, and...
Curated OER
Graphing Pasta
Students sort and graph various types of pasta. Using pasta construction paper patterns or real pasta, they sort the pasta by color, size, and type, and record the data on a graph.
Curated OER
Shedding Light on the Weather with Relative Humidity
Learners study weather using a graphing calculator in this lesson plan. They collect data for temperature and relative humidity for every hour over a day from the newspaper, then place the data in their handheld calculator and examine it...
Curated OER
Linear and Exponential Models
Students investigate the differences between linear and exponential models. In this linear and exponential models lesson, students make a table of given data. Students determine if the data is linear or exponential by plotting the data...
Curated OER
Cars on the Curve
Second graders, using two dice, participate in a car race game called Cars on the Curve. They predict which car wins the game and records it in their Data Diary.
Curated OER
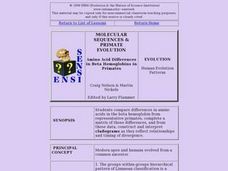
Molecular Sequences & Primate Evolution: Amino Acids, Hemoglobins in Evolution
Students compare differences in amino acids in the beta hemoglobin from representative primates, complete a matrix of those differences, and from these data, construct and interpret cladograms as they reflect relationships and timing of...
Curated OER
Polluting the Environment
Fourth graders construct mini-ecosystem, pollute the ecosystem, observe, collect, and record data on the effects of these pollutants on their ecosystem, organize data on spreadsheets, create graphs, and design presentations to share with...
Mathematics TEKS Toolkit
Grade 6: Exploring c/d = pi
Introduce your math class to the perimeter of a circle. Teach them that pi describes the relationship between the circumference and the diameter. As a hands-on investigation, pairs or small groups use string to compare these two values...
Curated OER
Straw Breathing Exercise
High schoolers fill out an anonymous questionaire to explore whether they might have asthma. They then set up a spreadsheet to enter the data, decide on a definition of asthma, and figure out the prevalence of asthma. Pupils simulate...
Curated OER
Environment: Wild Wind Direction
Students examine the different types of wind patterns. Using common materials, they construct weather vanes to measure and record wind direction over a two-week period. After analyzing the data, they draw conclusions about the...
Curated OER
Ocean Currents and Sea Surface Temperature
Students use satellite data to explore sea surface temperature. They explore the relationship between the rotation of the Earth, the path of ocean current and air pressure centers. After studying maps of sea surface temperature and ocean...
Curated OER
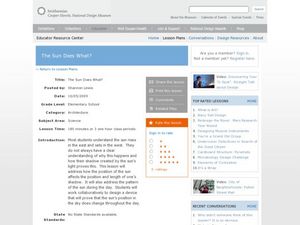
The Sun Does What?
Students examine why the sun rises in the east and sets in the west. In this sun lesson, students explore the sunset and shadows. Students prove that the sun's position changes during the day. Students investigate what causes a shadow....
Curated OER
Satellite Sense
Students look at data to understand how it is interpreted by scientists. In this satellite sense lesson, students complete worksheets based on radar and satellite images. Students work in groups of two to diagram a landform.
Curated OER
Tadpoles
Learners examine tadpoles at various stages of development. Questions in observation category assess students' ability to use a variety of senses to observe data in a certain way-scientific way.
Curated OER
Describing an Object's Position
Pupils explore language arts by participating in a shape identification activity. In this geometry shape lesson, students discuss the vocabulary terms used to describe the location of an object. Pupils complete a worksheet based upon...
Curated OER
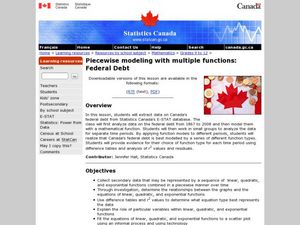
Piecewise Modeling with Multiple Functions: Federal Debt
Students analyze data on debt and write an equation. In this statistics lesson, students are given data from different time periods, and are asked to graph and analyze the data. They work in groups, and are assigned different parts of...
Curated OER
Who Done It?
Pick and choose which activities to include in this crime scene investigation. Junior detectives can examine fingerprints, DNA, blood samples, or bone structure. The plan suggests you have teams solve a mystery, but it does not give you...
Science 4 Inquiry
Fluid Streams Affecting Weather
The jet stream can reach speeds of up to 250 miles per hour. Scholars learn about the jet stream and ocean currents as they rotate through stations. They answer questions leading them to understand the impact these fluid streams have on...
Curated OER
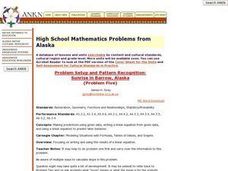
High School Mathematics Problems from Alaska: Problem Setup and Pattern Recognition: Sunrise in Barrow, Alaska
Young scholars make predictions using given data, writing a linear equation from given data, and using a linear equation to predict later behavior.
Curated OER
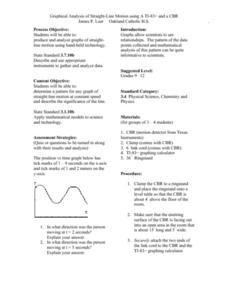
Graphical Analysis of Straight-Line Motion
Students investigate the concept of straight line motion. They determine the pattern and graph it looking for the motion maintained at a constant speed. Students also write a description of the significance of the line. The skill of...


