Curated OER
Junk Food Math
Students use Skittles candies as they explore estimation and percentages. In this math lesson plan, students sort, count, and chart Skittles candies to learn about estimation and study percentages.
Curated OER
Environmental Mathematics
Eighth graders determine food that they would need to survive in the wild. They graph the best foods for their environments and rate the survivability rate for each member of their group.
Virginia Department of Education
Middle School Mathematics Vocabulary Word Wall Cards
Having a good working knowledge of math vocabulary is so important for learners as they progress through different levels of mathematical learning. Here is 125 pages worth of wonderfully constructed vocabulary and concept review cards....
Curated OER
Time Management
Students plot activities for a 24 hour day. They record their information on a spread sheet program. Students list categories they use and write equations for cells that add cells of each category together. Students create a pie chart of...
Granite School District
7th Grade CCSS Math Vocabulary Word List
Address key vocabulary in the seventh grade Common Core Math Standards with this comprehensive list. A series of word cards is also provided that supports each term with images and examples, making this an excellent tool for teaching the...
Curated OER
How Fast Is Your Car?
Eighth graders discover the relationship between speed, distance, and time. They calculate speed and represent their data graphically. They, in groups, design a ramp for their matchbox car. The goal is to see who's ramp produces the...
Curated OER
Finding the Area Under A Curve with Random Probability
Young scholars explore the concept of area under a curve. In this area under a curve lesson plan, students find the area under a curve using the Monte Carlo method using random points and probability. Young scholars calculate the area...
Curated OER
The Mathematics of Space and Place
Students investigate the measurements and geometry of the school grounds. They conduct inquiry while measuring the campus and some of the city blocks. Then students draw a map to scale and categorize property types using a pie graph.
Curated OER
Worksheet 26
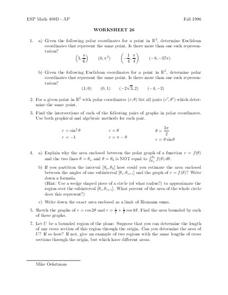
In this math worksheet, students use the polar coordinates to find the Euclidian coordinates. Then they compare points on the coordinate plane.
Curated OER
A Statistical Look at Jewish History
Students complete their examination over the Jewish Diaspora. Using population figures, they discover the importance of percentages in exploring trends. They use their own ethnic group and determine how it is represented in the United...
McGraw Hill
Glencoe: Self Check Quizzes 2 Circle Graphs
Use Glencoe's Math Course 2 randomly generated self-checking quiz to test your knowledge of circle graphs. Each question has a "Hint" link to help. Choose the correct answer for each problem. At the bottom of the page click the "Check...
McGraw Hill
Glencoe: Self Check Quizzes 1 Circle Graphs
Use Glencoe's randomly generated self-checking quiz to test your knowledge of circle graphs. Each question has a "Hint" link to help. Choose the correct answer for each problem. At the bottom of the page click the "Check It" button and...
Math Graphs
Houghton Mifflin: Math Graphs: Percents and Circle Graphs 1 [Pdf]
Students calculate the percent of the total income for sources of income and expenses. Learners then use this information to create a circle graph. The handout is available in PDF format.
ClassFlow
Class Flow: Reading Circle Graphs
[Free Registration/Login Required] Students are asked to figure out the size of the shaded portions of a circle graph. They then complete a chart showing the fraction, decimal, and percentage equivalents.
Math Graphs
Houghton Mifflin: Math Graphs: Percents and Circle Graphs 2 [Pdf]
Students calculate the percent of the total expenses for sources of income and expenses. Learners then use this information to create a circle graph. The handout is available in PDF format.
Texas Instruments
Texas Instruments: Math Today the Next Frontier for Flight
This activity provides students the opportunity to gain experience in creating circle graphs on the calculator and provides an excellent real-world review of computation with percents.
Texas Instruments
Texas Instruments: Grandparents and Special Friends Day
This lesson was designed for our Grandparents and Special Friends day. It can be used for any visitation day, or an open house. The lesson is designed to review percent of a whole and the sector of the circle representing the percentage....
E-learning for Kids
E Learning for Kids: Math: Group of Pyramids: Fractions and Graphs
On this interactive website, students practice various math skills using a real-life scenario at the pyramids. Those skills include showing percentages as fractions and decimals and interpreting data in a sector graph.
University of Texas at Austin
Mathematics Teks Toolkit: And We Go Around
Collect and display data using a bar and circle graph to explore fractions and percents.


![Houghton Mifflin: Math Graphs: Percents and Circle Graphs 1 [Pdf] Unknown Type Houghton Mifflin: Math Graphs: Percents and Circle Graphs 1 [Pdf] Unknown Type](https://d15y2dacu3jp90.cloudfront.net/images/attachment_defaults/resource/large/FPO-knovation.png)


