Rochester Institute of Technology
Skateboard Assembly - Cycle Time
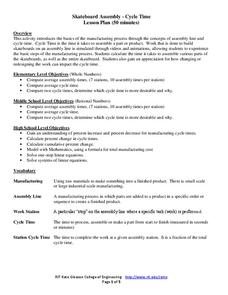
Assemble a great activity on assembly lines. In the first installment of a nine-part technology/engineering series, future entrepreneurs learn about the manufacturing process, specifically about the assembly line and cycle time. The...
Kenan Fellows
Density
Most scholars associate density with floating, but how do scientists determine the exact density of an unknown liquid? The third lesson in a seven-part series challenges scholars to find the mass and volume of two unknown liquids. Each...
Beyond Benign
Water Bottle Unit
How much plastic do manufacturers use to create water bottles each year? The class explores the number of water bottles used throughout the years to determine how many consumers will use in the future. Class members compare different...
Mathed Up!
Ordering Fractions, Decimals, and Percentages
Give scholars the opportunity to show what they know about ordering fractions, decimals, and percents with a five-page, eight-problem independent practice. With clear instructions and supportive advice, learners are bound for a...
Inside Mathematics
Vencent's Graphs
I like algebra, but graphing is where I draw the line! Worksheet includes three multiple-part questions on interpreting and drawing line graphs. It focuses on the abstract where neither axis has numbers written in, though both are...
CCSS Math Activities
Smarter Balanced Sample Items: 8th Grade Math – Claim 4
A math model is a good model. A slide show presents 10 sample items on modeling and data analysis. Items from Smarter Balanced illustrate different ways that Claim 4 may be assessed on the 8th grade math assessment. The presentation is...
Balanced Assessment
Who's Left?
If you're not right-handed, are you wrong-handed? Young statisticians calculate the percentage of left-handed people using a given data set in the assessment task. They plot data on a scatter plot and consider how the line of best fit...
Inside Mathematics
Conference Tables
Pupils analyze a pattern of conference tables to determine the number of tables needed and the number of people that can be seated for a given size. Individuals develop general formulas for the two growing number patterns and...
CCSS Math Activities
Smarter Balanced Sample Items: High School Math – Claim 3
Communication is the key. A presentation provides 25 sample items for Claim 3, Communicating Reasoning, for the Smarter Balanced High School Math assessment. Items require pupils to answer the question and provide logical reasoning to...
Radford University
Sleep and Teen Obesity: Is there a Correlation?
Does the number of calories you eat affect the total time you sleep? Young mathematicians tackle this question by collecting their own data and making comparisons between others in the class through building scatter plots and regression...
Curated OER
Pizza Possibilities
Students create and interpret line plots, bar graphs, and circle graphs. The lesson assumes mastery of conversions from fraction to decimal to percent, construction of angles, and at least an introduction to graphs displaying data.
Curated OER
Bits and Pieces I
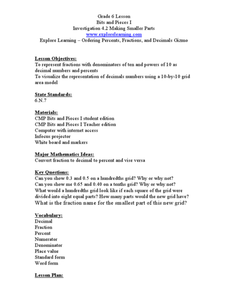
Sixth graders examine making smaller parts out of fractions and decimals. In this online interactive fractions, decimals, and percents lesson, 6th graders represent fractions with denominators of ten. Students then represent powers of 10...
Curated OER
Fire!, Probability, and Chaos
Upper elementary and middle schoolers work with the concept of probability. They are introduced to the concept of chaos. Learners graph and analyze using a line plot, work with mean, and are introduced to the concept of variance.
Curated OER
Solving Math Problems In the Real World
Upper elementary and middles schoolers discuss and solve real world applications of math. They use formulas for volume and percents to answer real world questions. In the second part of the lesson, groups write and solve word problems....
US Department of Commerce
Featured Activity: Population Change Over Time
Keep track of a state's population. After a brief discussion on how population data is used for funding, individuals look at population changes over time. Pupils find the population of two states using three different censuses. They then...
Scholastic
Study Jams! Rounding Decimals
Jeans length is a hot topic for preteens, and in this lesson, Mia helps us figure out how to round the length of various pairs so that Zoe can get some as close to 32.45 inches as possible. She uses a number line or ruler to prove the...
Curated OER
Bits and Pieces - More About Percents - Online Manipulatives
In this online percentages worksheet, students access the Library of Virtual Manipulatives web site and open the percentage tool. They use the online tool to complete 8 multi-step questions making graphical representations and finding...
Curated OER
"NSN, Fractions, Percents, Ratios, Rates" Investigations
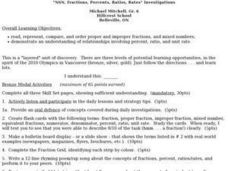
Sixth graders engage in an investigation about the concepts related to fractions. They read, represent, compare, and order proper and improper fractions, and mixed numbers. They demonstrate an understanding of relationships involving...
Curated OER
One Size Fits All, Part 1
Can you tell how tall someone is just by looking at their feet? In this activity, young mathematicians measure their height, arm span, and foot size, graph their findings, and answer questions about how these measurements are related....
NASA
Resolving 2-Plane Traffic Conflicts by Changing Speed—Problem Set E
What do you do to change arrival times of airplanes when a different route is not available? The fifth interactive in a series of six presents problems where pupils must find solutions to conflicts of safety rules. They must decide how...
Curated OER
Visualizing Decimals
For this visualizing decimals worksheet, 7th graders solve 14 different problems that include various forms of decimals. They fill in the missing hundredths parts on each number line. Then, students write the number the picture shows in...
Curated OER
A New Life
Students write a paper about how their life would be different if fractions, decimals and percents did not exist. The teacher leads a discussion after the papers are written.
Curated OER
Giving it 100%
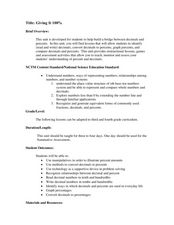
Learners build knowledge about the number relationships between decimals and percents as it relates to converting decimals into percents. In this decimal and percent lesson, students recognize equivalent forms of fractions,...
Curated OER
Skateboards
Middle schoolers examine two plants that make skateboards. They practice converting fractions to percents in real life applications.


