Curated OER
Percentages, Fractions, Decimals, and Square Models
In this middle school mathematics lesson, students convert between percents, fractions, and decimals. Students shade the regions of a 10 by 10 square to represent the given number. The two page worksheet contains eight problems. ...
Curated OER
Motherhood Math: Mothers in the Workforce
Students evaluate a table showing how the number of working mothers increased between 1955 and 2000. They use the information from the table to complete a worksheet imbedded in this instructional activity.
Curated OER
WS 1.0 Math Skills Update
In this math skills worksheet, students find percentages, they convert from ordinary notation to scientific notation, they convert from scientific notation to ordinary notation and they manipulate algebraic expressions.
101 Questions
The Biggest Loser
Sometimes losing is actually winning! Learners use a proportional analysis to compare percent weight loss of contestants on The Biggest Loser. The resource provides data and clips from the show to facilitate the lesson.
Newspaper Association of America
By the Numbers: Mathematical Connections in Newspapers for Middle-Grade Students
A cross-curricular resource teaches and reinforces mathematical concepts with several activities that use parts of a newspaper. Scholars use scavenger hunts to find the different ways math is used in the paper along with using data...
Curated OER
Representing Fractions, Decimals, and Percents
In this fractions, decimals, and percents lessons, students explore various methods of representing fractions. They demonstrate situations that represent rational numbers. Students create a foldable exploring fractions, decimals and...
Roald Dahl
Matilda - Bruce Bogtrotter and the Cake
After reading the 11th chapter in Matilda, class members take on the role of Bruce Bogtrotter and re-enact the cake eating scene. Here's the catch: they must come-up with an impromptu re-enactment of the scene from the story, and use...
Teach Engineering
Energy and the Pogo Stick
Let your class bounce to examine the concept elastic potential energy. Individuals bounce on a pogo stick in order to calculate its elastic potential energy. Groups then compare the elastic potential energy to the gravitational potential...
EngageNY
Federal Income Tax
Introduce your class to the federal tax system through an algebraic lens. This resource asks pupils to examine the variable structure of the tax system based on income. Young accountants use equations, expressions, and inequalities to...
101 Questions
The Incredible Shrinking Dollar
Make money disappear! Young scholars watch as a copier shrinks a dollar bill to 75 percent of its size. Learners are left to determine the size of the dollar bill after nine passes through the copier.
5280 Math
Interesting Times
Gain a little interest in functions with a real-life task. Young scholars analyze home loan data with a geometric sequence and series. They use the models to make predictions about the total loan payments at certain intervals in a useful...
Concord Consortium
Hockey Pucks
Package design is a mathematical task for any business. Young scholars use a package design to determine the number of packages required for specific shipments. Using ratios, proportions, and fractions, they make decisions about the best...
Math Worksheets Land
Patterns of Association (Using Data Tables) - Independent Practice Worksheet
Here is a worksheet that belongs in a four-part resource that has learners practice using data tables to calculate percentages. The page has ten problems with different data tables asking to find different percents.
Illustrative Mathematics
Do You Fit In This Car?
A short activity that focuses on the normal distribution as a model for data distribution. Using given means and standard deviations, your budding statisticians can use statistical tables, calculators, or other statistical software to...
Curated OER
The Stock Market
Students explore the loss and gain made in the stock market as they invest a sum of money and report the results as percentages instead of points.
Curated OER
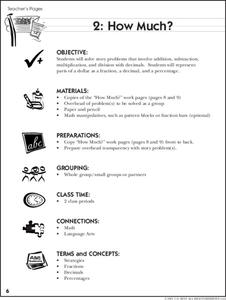
How Much?
It's time to go back over all that your class has learned about decimals, fractions, and percentages! To do so, individuals solve story problems that involve addition, subtraction, multiplication, and division with decimals, explain how...
Curated OER
Explore Surface Types on a Journey Around Earth
Students explore satellite data. In this technology cross-curriculum math and world geography lesson, students locate specific map areas using a microset of satellite data. Students use technology and math skills to determine percentages...
Curated OER
60-30-10
Students use ratios and proportions to represent quantitative relationships as they investigate the concept of how percentages are used by designers. Students decorate the same room using three different percentages of colors.
Curated OER
Mathematics & Nutrition
Students apply math to calculate fat and calories in the food they eat. They examine food package information to become aware of the ingredients and to learn about healthy life styles. They work in groups to create crazy meals using the...
Curated OER
Scaling Up Art
Students measure a sculpture of a human and measure other students. They determine the average size of humans and create a life size image of the sculpture. They work with percentages as they create the images.
Curated OER
Graphs: All About Our Class
Students respond to survey questions, discuss results, brainstorm ways to represent survey information, and create table of class results. They find mean, range, and percentages, and create graph to display results.
Curated OER
Computation with Fractions
Upper graders are introduced to the topic of fractions and percentages. In groups, they discuss real world situations in which fractions are present, and they complete a worksheet solving problems with common and uncommon denominators....
Curated OER
Survival Hunt
Students search for yarn representing insects on school grounds. They discuss which colors where found more frequently and why after the experiment. They use their math skills to determine percentages.
Curated OER
Dominos As Fractions
Students investigate the concept of using fractions in a variety of different contexts. They participate in a hands on activity in the stead of book work. The goal is to get them acquainted with the use of fractions using mental math...
Other popular searches
- Math Percentages
- Math Lessons on Percentages
- Calculator Math Percentages
- Learning Math Percentages
- Math Percentages Diagram
- Teaching Percentages in Math
- Math Percentages Ecology
- Math Percentages Decimals
- Teaching Math Percentages
- Football Math Percentages
- Everyday Math Percentages
- Converting Math Percentages


