Curated OER
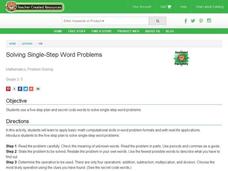
Solving Single-Step Word Problems
Math wizards learn the five-step plan to solve math word problems. They investigate the five-step process for solving word problems, and examine the use of code words for each of the operations and solve a problem using the strategies.
Math Worksheets Land
Markups and Markdowns Word Problems - Matching Worksheet
Show learners how math is all around them with a instructional activity that practices with percentage change. Match the eight problems regarding markups and markdowns to the answer choices, and see if they are ready to start shopping in...
Curated OER
Using Simple Equations To Solve Word Problems
In this math worksheet, learners learn to read a word problem, write an equation, solve for the variable and write and label the answer. There are examples given at the top of the page although directions tell students to "use...
Illustrative Mathematics
SAT Scores
If you earned a score of 610 on the math portion of the SAT, what would be your percentile ranking? Given the mean and standard deviation of normally distributed data, find the probability of getting a particular score, or that your...
Curated OER
Scaling Down Art
Students change the scale of a work of art using ratios, percentages, and proportions. While this is technically an art lesson, there is quite a bit of mathematics involved in converting to the correct scale.
Curated OER
Charts and Graphs
Fifth graders interpret data into graphs and percentages. In this organizing data instructional activity, 5th graders discuss bar, circle and line graphs. Students complete bar graph and apply probability using the results.
Curated OER
Data Management and Probability: Applications
In this data management and probability applications instructional activity, 7th graders solve 13 different types of problems that include finding the mean, median, mode, and range of each set of values, as well as, solving a number of...
Curated OER
Arithmetic: Decimals, Fractions, and Percentages
In this decimals, fractions, and percents worksheet, learners review many different concepts related to parts of a whole, such as adding and subtracting decimals, converting decimals to fractions, converting fractions to decimals,...
Curated OER
How Do Dinosaurs Measure Up?
Students measure and draw to scale, a representation of a dinosaur to practice math skills.
Curated OER
Probability Experiment
Students do an experiment with probability. In this probability lesson, they listen to part of the book G is for Googol: A Math Alphabet Book by David M. Schwartz. They complete 3 probability experiments and check to see how close their...
Curated OER
Jambalaya's Restaurant
Young scholars use a menu and recipes to work on adding, subtracting, and percentages. They are given they weekly circulators, advertisements, or actual products and students practice figuring out sales tax. Young scholars figure slaes...
Curated OER
Place Value Puzzle #1
In this math instructional activity, students solve 8 place value puzzles in which clues are given about the placement of the digits in the ones, tens, hundreds and thousands place.
Curated OER
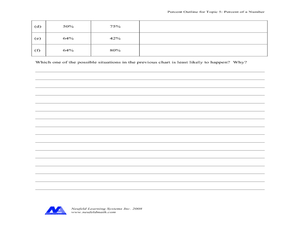
Percent of a Number
For this percent worksheet, students complete problems such as changing percents to decimals, filling in percentage charts, and more. Students complete 8 problems.
Curated OER
How Much Land?
In this math word problems activity, students solve problems having to do with different percentages of land. Students complete 6 questions.
Curated OER
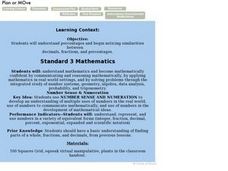
Plan or Move
Students note the similarities between decimals, fractions and percentages. They practice converting numbers between these types. They participate in an activity as well.
Curated OER
What's Left?
Students work together to choose a favorite food that can be divided. Using construction paper, they draw a picture of the food and take turns erasing it to determine how much of it is left. They must include all equations, fractions and...
Yummy Math
Twinkies
Brian was devastated when Hostess® filed for bankruptcy, and he was also fearful that his favorite snack treat would be lost forever. The snack food was in danger of being lost, your class won't be lost when using Twinkies® as the...
Curated OER
AR Point Record
In this record worksheet, students color in one square for each point earned. After they fill out each 25-point square, they can record their average percentage.
Curated OER
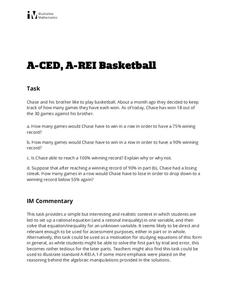
Basketball
Tap into the competitive nature of teenagers as your class practices setting up and solving rational equations. This activity starts with a specific ratio of games won to games played, then asks how many more games must be played to...
Math Worksheets Land
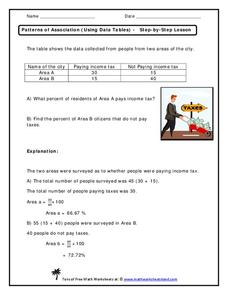
Patterns of Association (Using Data Tables) - Step-by-Step Lesson
This worksheet belongs to a four-part resource that gathers information from data tables to calculate percentages. The page introduces one problem and shares an explanation to the answer.
Illustrative Mathematics
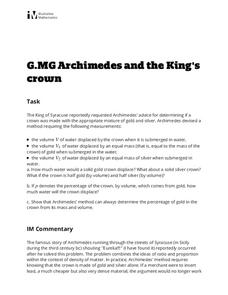
Archimedes and the King's Crown
Learners will shout "Eureka!" in this quick but deep activity replicating the famous bathtub experiment of Archimedes. Given the scenario of a king with a suspected fake crown, young investigators develop formulas using density to...
Balanced Assessment
Presidential Popularity
Media often misrepresent data and statistics to their advantage. This lesson asks scholars to analyze an article with misleading statistics. They use margin of error and mean data in their studies. Once they complete their analysis,...
EngageNY
Comparing Distributions
Data distributions can be compared in terms of center, variability, and shape. Two exploratory challenges present data in two different displays to compare. The displays of histograms and box plots require different comparisons based...
National Wildlife Federation
How Many Bison?
Math and science to the rescue! Some basic math concepts help scientists predict wildlife populations. Using tokens, groups simulate tagging a wildlife population. They then use proportions to estimate the population of the wildlife.
Other popular searches
- Math Percentages
- Math Lessons on Percentages
- Calculator Math Percentages
- Learning Math Percentages
- Math Percentages Diagram
- Teaching Percentages in Math
- Math Percentages Ecology
- Math Percentages Decimals
- Teaching Math Percentages
- Football Math Percentages
- Everyday Math Percentages
- Converting Math Percentages


