National Research Center for Career and Technical Education
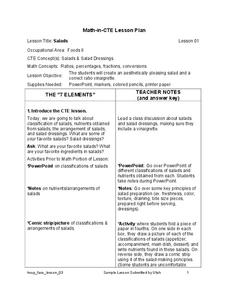
Salads
Lettuce talk for a moment about your culinary scholars; do they have what it takes to create a great salad? Show them the finer points of salad preparation with a career and technology lesson that combines direct instruction, creativity,...
Howard Hughes Medical Institute
Patterns in the Distribution of Lactase Persistence
We all drink milk as babies, so why can't we all drink it as adults? Examine the trend in lactase production on the world-wide scale as science scholars analyze and interpret data. Groups create pie charts from the data, place them on a...
Science Geek
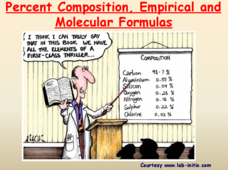
Percent Composition, Empirical and Molecular Formulas
Help your pupils understand when empirical becomes molecular. The lesson presentation demonstrates the connection between empirical formulas and molecular formulas. Then, given percent composition, the lesson demonstrates the steps to...
It's About Time
Petroleum and Your Community
I was going to write a joke about oil, but it seemed crude. This lesson starts with a comparison of where the US gets oil from and how that has changed over time. After analyzing the data, scholars create a graph and use the Internet to...
It's About Time
Oil and Gas Production
Would you consider a power failure a current event? This lesson uses multiple experiments, guided inquiry activities, and group discussions to cover the topics of oil and gas production. This is the seventh lesson in a series of eight.
Curated OER
Scatterplots
In this scatterplots worksheet, students construct a scatter plot from a given data set. Students then answer 4 questions regarding the least-squares regression line and making predictions.
Curated OER
Population Pyramids
Students create a population pyramid based on current data for their final project country. They analyze data from comprehension trends of final project country. Students analyze populations of specific countries.
Curated OER
Voting Systems
In this voting systems learning exercise, high schoolers read story problems and then use various methods to determine the probable winner of an election. They use the Plurality and Borda tables to determine outcomes. This two-page...
Curated OER
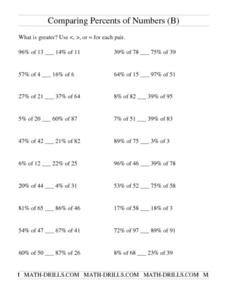
Comparing Percents of a Number
In this comparing percents worksheet, students solve 22 problems in which two percents of numbers are compared using the <, >, or = sign. Example: 60% of 50 and 87% of 26. There is not room on the paper for calculations.
Curated OER
Finding Percents of a Number (A)
In this percents learning exercise, students solve 40 problems in which the percent of a number is calculated. (Example: 35% of 31). There is no instruction on the page.
Curated OER
Balancing the Scales: Understanding Ratios
Students are introduced to the concept of ratios. In groups, they convert sets of numbers into a ratio. After practicing, they use the ratios and proportions to solve story problems. They also calculate map distances and discover map...
Curated OER
X Is What Percent Of Y?
In this percents worksheet, students complete 2 multiple choice questions where they find the percent of a number. Answers are given online.
Curated OER
Calculating Percents 2
In this calculating percents practice worksheet, middle schoolers use their problem solving skills to calculate the percents of the 10 listed numbers.
Curated OER
Equivalent Fractions Worksheet: Worksheet 1, Level 4
In this fractions worksheet, students solve 12 problems in which a fraction is analyzed. From four possible choices, students mark the fraction that is equivalent.
Curated OER
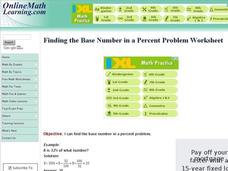
A Number is X% of What Number?
For this algebra worksheet, students solve for the base of a number given the percent and its partial amount. There are 10 questions.
Curated OER
Fraction Worksheet
In this fractions learning exercise, students complete fraction word problems dealing with numbers up to 12. Students complete 8 problems total.
Curated OER
Measuring Supporting Structures
Students calculate the volume of the Pantheon's columns and estimate changes in weight given different parameters.
Curated OER
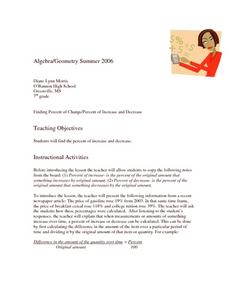
Finding Percent of Change/ Increase or Decrease
Seventh graders explore the skill of finding the increase and decrease of a quantity. Calculating the increase and decrease is covered by a percent. The proporition for finding a percent is also part of the lesson.
Curated OER
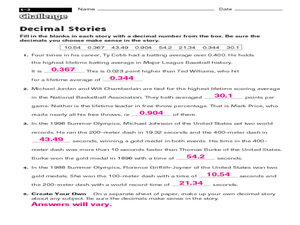
Decimal Stories
For this decimal worksheet, students fill in decimal numbers in a story, choosing from a "decimal box" at the top of the page, filling in blanks so that the story makes sense.
Curated OER
Percent Word Problems
In this online worksheet, learners will solve 10 problems involving percents. Answers can be accessed by clicking hint or check.
Curated OER
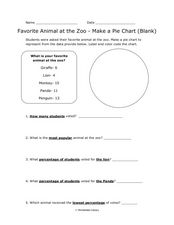
Pie Chart: Favorite Animal at the Zoo
In these three interpreting a pie chart and answering questions worksheets, students use the data provided to label and color code the blank and outlined pie charts, read and interpret a completed pie chart, and then answer questions...
Curated OER
Using Ratios to Taste the Rainbow
Students solve problems using ratios and proportion. In this algebra lesson, students analyze skittles and their different colors as they apply the properties of ratios and proportions to solve their problems.
Curated OER
Are You 100%?
Students use decimals, fractions, and percents to solve problems in a real world setting.
Curated OER
Solar Storm Energy and Pie Graphs
In this solar storm energy and pie graphs learning exercise, students solve 5 problems using pie graphs that show the amount of solar energy that is converted into radiation, kinetic energy, flare energy and flare energy that is lost to...
Other popular searches
- Math Percentages
- Math Lessons on Percentages
- Calculator Math Percentages
- Learning Math Percentages
- Math Percentages Diagram
- Teaching Percentages in Math
- Math Percentages Ecology
- Math Percentages Decimals
- Teaching Math Percentages
- Football Math Percentages
- Everyday Math Percentages
- Converting Math Percentages


