Curated OER
Circles
For this circles worksheet, 10th graders solve 10 different problems that include determining the chords, secants, and tangents of circles shown. First, they determine 4 different line segments given a circle with secants and chords with...
Curated OER
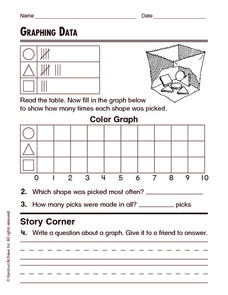
Graphing Data
In this graphing data worksheet, students solve and complete 8 different word problems related to graphing data given. First, they determine the percent of people who do not believe in any of the phenomena described and explain. Then,...
Curated OER
Find the Mystery Lines...If You Can!
In this atomic spectral lines worksheet, students observe a diagram of the spectral lines, their different wavelengths and their intensity. They solve 4 problems which include interpreting the scale, matching up tabulated lines with the...
Curated OER
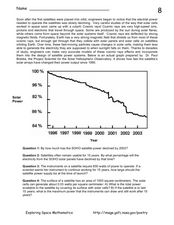
Cosmic Rays and Solar Cells
In this cosmic rays and solar cells worksheet, students read about how cosmic rays damage the electrical output of solar cells over time on satellites. Students use a graph of the solar power output compared to the year for the SOHO...
Curated OER
Magnetic Storms
In this magnetic storms and Earth's magnetic field activity, students use a bar graph showing the Kp Index for planetary variability. Students use the bar graph to answer 3 questions about the solar storms and their Kp values.
Curated OER
Do Fast CMEs Produce Intense SPEs?
In this coronal mass ejections and Solar Proton Events worksheet, students create a Venn Diagram to represent given data. They answer 5 questions about the data related to the number of coronal mass ejections and Solar Proton Events...
Curated OER
Economics: Supply, Demand & Personal Finance
In this Economics/Personal financial literacy worksheet, students use USA Today to find article, photos, charts, or graphics related to events that are affecting the prices of different products and services. Students answer questions...
Curated OER
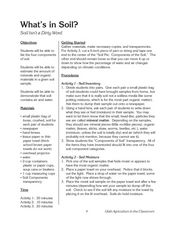
What's in Soil?
Young scholars examine soil samples and make observations. For this soil lesson, students participate in experiments to determine the components (mineral matter, organic matter, water air) in the soil. Young scholars analyze a pie graph...
Curated OER
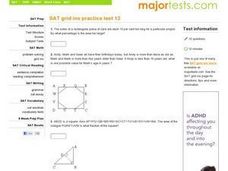
SAT Grid Practice Test 12
In this SAT practice test, students solve various problems dealing with percent, area of polygons, rates, functions, and distance. This one page on-line instructional activity contains ten multi-step problems.
Curated OER
Infusing Equity in the Classroom by Gender
Students investigate the idea of gender descrimination in the classroom. For this algebra lesson, students collect data in stereotyping, and gender bias in the classroom, school materials and activities. They graph and analyze their...
Curated OER
Graphing Surveys and Analyzing Data
Students analyze data and graph the results of their surveys. In this statistics lesson plan, students create graphs using excel to make graphs to be able to better observe their data. They conclude how great we as unique individuals.
Curated OER
Race and Gender in the Media
Students analyze race and gender in the media. In this algebra lesson plan, students apply their knowledge of percents and ratios to determine the representation of race and gender in the media. They discuss and graph their data.
Curated OER
Percent Notation
In this algebra worksheet, students divide circles into equal portions as they explore percents and decimals. They convert between decimals and fractions using ratio and proportion. There are 8 questions.
Curated OER
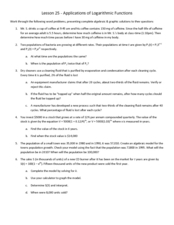
Lesson 25 - Applications of Logarithmic Functions
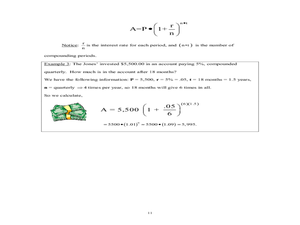
in this applications of logarithmic functions worksheet, students solve 11 short answer problems. Students use logarithms to find half lives, compound interest, and population growth given a word problem.
Curated OER
Pre-calculus Unit 3 Test 2
Students will solve exponential function problems, graph exponential functions, find the value of logarithms, determine future value, and compound interest. In this Pre-calculus lesson, students will use the properties of logs to solve...
Curated OER
The Sun as the Driving Force of the Water Cycle
Young scholars study the water cycle and how the sun is an important factor. In this water cycle activity students investigate how to desalinate water and explore the different densities of fresh versus saltwater.
Curated OER
Making the Connections
Use a Horton Chart to identify relationships between numbers and make equivalent fractions and decimals. Scholars change a fraction to find the greatest common factor, find percents, and make equivalent decimals.
Curated OER
What Are the Odds?
Middle schoolers identify and interpret various ways of expressing probability as a decimal, fraction, percent, or ratio. They solve problems based on probability as they apply to real world applications.
Curated OER
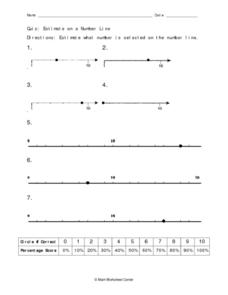
Estimate on a Number Line
Using a number line worksheet, learners solve seven different problems using the shown number line in each. They estimate what number is selected on the number line in each problem and write it out.
Curated OER
Math and Science in a Wetland
Students use scientific methods during field and lab investigations. Students collect specimens and make measurements using the metric system. Students describe biotic and abiotic factors in an estuary and design a model.
Curated OER
Money Circulation: A Story of Trade and Commerce
Students are introduced to the meaning, symbolism, and value of the quarter. They determine the percentage of total monetary value held in quarters and graph the results. Students infer about the U.S. Mint's distrubution of coins. They...
Curated OER
Different Perspectives of Oregon's Forest Economic Geography
Students map data on employment in wood products manufacturing in Oregon counties. In this Oregon forest instructional activity, students discover the percentage of people employed in the forest manufacturing industry. Students create a...
Curated OER
The Atmosphere
Students calculate the percentage of oxygen in the atmosphere. They create a semi-scale drawing of the atmosphere.
Curated OER
Problem-Solving Application: Use Circle Graphs
In this problem-solving worksheet, 5th graders problem-solve 2 mathematical equations involving 4 key steps and 2 circle graphs.
Other popular searches
- Math Percentages
- Math Lessons on Percentages
- Calculator Math Percentages
- Learning Math Percentages
- Math Percentages Diagram
- Teaching Percentages in Math
- Math Percentages Ecology
- Math Percentages Decimals
- Teaching Math Percentages
- Football Math Percentages
- Everyday Math Percentages
- Converting Math Percentages


