Curated OER
Percents Less Than One and Greater Than 100
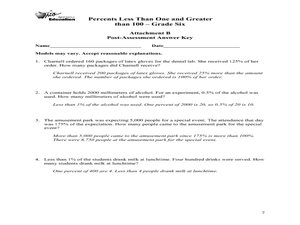
Sixth graders express numbers as percents greater than 100 and less than one. In this lesson on percents, 6th graders work in groups with real life scenarios to develop an understanding on percentages greater than 100 and less than one....
Curated OER
Shots, Standings, and Shopping
Rates and ratios can easily be applied to real-world situations. Learners explore a series of websites in order to procure comparable data. They define ratios and rates, view videos, and use the internet to explore how ratios and rates...
Curated OER
Empirical Rule Practice Problems
Using the empirical rule for a normal distribution, young statisticians determine the percent of adult women with given heights and weights. They find the percentile rank of a woman of a stated height and find the area under a curve.
Curated OER
Probability using M & M's
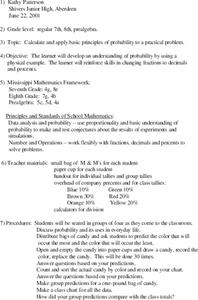
Using M & M's candies, young statisticians predict the color distribution in a packet of candies and test their predictions against their group and the larger class. A review of converting between fractions, decimals, and percents...
Curated OER
Is Bigger Always Better?
Explore rational numbers with the young mathematicians in your class. They will investigate decimals, fractions, and percents before ordering and comparing rational numbers. This multi-day unit includes differentiation activities and...
Curated OER
Word Problem Practice Workbook
Need worksheets that challenge your middle schoolers to apply their understanding of math? Problem solved! From integers, fractions, and percents, to algebra, geometry, and probability, over 100 pages of word problem worksheets are...
Concord Consortium
Hockey Pucks
Package design is a mathematical task for any business. Young scholars use a package design to determine the number of packages required for specific shipments. Using ratios, proportions, and fractions, they make decisions about the best...
Inside Mathematics
Swimming Pool
Swimming is more fun with quantities. The short assessment task encompasses finding the volume of a trapezoidal prism using an understanding of quantities. Individuals make a connection to the rate of which the pool is filled with a...
Curated OER
Solving Percent Problems with Proportions
Seventh graders explore the concept of percent problems. In this percent problem lesson, 7th graders use proportion equations to solve percent problems. Students find percentages of numbers and use proportions to determine percents in...
Curated OER
Stoichiometry
In this stoichiometry worksheet, students use balanced equations for chemical reactions to determine the percent yield and the mass of product produced. This worksheet has five problems to solve.
Bowland
Design the Mascot
Explore how resizing an object affects its area. The set of lessons challenges young mathematicians to design a mascot for electronic devices. These designs undergo resizing to determine how scale factors of dilation affect area.
Curated OER
Largest Hamburger Ever?
If a 150 lb. person can comfortably eat and digest a 1 lb. burger, then how large would the person be who can comfortably eat and digest a 350 lb. burger? For a burger that size, it would take either a large person or a class of really...
EngageNY
Using a Curve to Model a Data Distribution
Show scholars the importance of recognizing a normal curve within a set of data. Learners analyze normal curves and calculate mean and standard deviation.
Curated OER
Proportion to Percentage
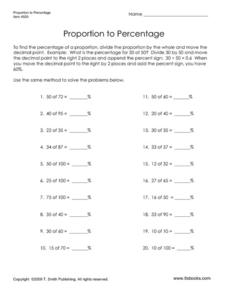
In this division worksheet, 7th graders divide the proportion number given by the whole and move the decimal point to place to find the percent value.
Curated OER
Average and Percentages - Week 2
In this average and percent worksheet, students solve percentage problems by using proportions. These story problems include sequences, percent of change and cost. This two-page worksheet contains seven problems.
Curated OER
Proportion and Percent
In this worksheet on proportion and percent, students review the concepts, then find the percentage for proportions in 10 word problems.
Curated OER
Three Bean Salads
In this math worksheet, student compare the recipes for three different salads. Using the concepts of percents and proportions the amount of beans is calculated.
Curated OER
What Are the Odds?
Middle schoolers identify and interpret various ways of expressing probability as a decimal, fraction, percent, or ratio. They solve problems based on probability as they apply to real world applications.
Yummy Math
US Holiday Candy Sales
Candy is a big business! Calculate the amount of money consumers spent on major holidays—Easter, Halloween, Christmas, Hanukkah, and Valentine's Day—based on the total amount of candy sales from 2011 and the percentage of each holiday's...
Curated OER
Nutrition: A Thematic Unit
Young learners explore nutrition and the food groups in these two mini-lesson plan ideas. First, kindergarteners have a discussion about their health and how different foods contribute to it before making their own personal food pyramid....
Virginia Department of Education
Middle School Mathematics Vocabulary Word Wall Cards
Having a good working knowledge of math vocabulary is so important for learners as they progress through different levels of mathematical learning. Here is 125 pages worth of wonderfully constructed vocabulary and concept review cards....
Curated OER
Using the Proportion Method to Solve Percent Problems
In this algebra worksheet, students calculate the percents of a number. They convert between decimals and percents. There are 20 questions with an answer key.
Curated OER
Capture/Recapture
Students use proportions to estimate the size of populations. They describe the data with using a graph or table of the estimate. Students use descriptive statistics to calculate mean, median, and mode. They also compare and contrast an...
Curated OER
Numbers and Operations
Students practice using proportions to discover the fraction needed to use the right amount of an ingredient. They calculate the number of ounces in one gallon as well. They answer questions to complete the lesson.


