Curated OER
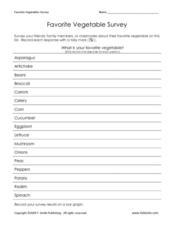
Favorite Vegetable Survey
What's your favorite? Use this chart template in your lesson on data collection and graphing. Learners record classmates' favorite vegetable in a survey, and then graph the results. A labelled graph is provided here- print both pages...
Curated OER
TV Survey - Data Collection and Analysis
In this data collection and analysis worksheet, 4th graders complete a tally chart about the number of hours that fourth graders watch television. They create a bar graph with the information, write a paragraph about the survey results,...
Curated OER
What Are Your Chocolate Eating Habits?
Students design and conduct a survey as an investigation of chocolate eating habits. They pool and analyze their results and consider which companies are making the largest profits based on the information gathered from their surveys.
Curated OER
Using Graphical Displays to Depict Health Trends in America's Youth
Identify the different types of graphs and when they are used. Learners will research a specific health issue facing teens today. They then develop a survey, collect and analyze data and present their findings in class. This is a lesson...
Federal Reserve Bank
Credit Cards - A Package Deal
Arm your learners with the information they will need to make smart decisions regarding credit cards and personal savings.
Virginia Department of Education
Calculating Measures of Dispersion
Double the fun — calculate two measures of deviation. The lesson plan provides information to lead the class through the process of calculating the mean absolute deviation and the standard deviation of a data set. After learning how to...
Curated OER
Tax, Tip and Discount Word Problems
Students solve problems involving tax, tips and discounts. In this algebra lesson, students convert between percents and decimals. They calculate commission using conversion from percents and fractions.
Curated OER
Data Analysis and Bias
In this probability and statistics instructional activity, students determine when a collected data or a graph of the data could be biased. The one page instructional activity contains four multiple choice questions. Answers are...
Curated OER
Consumer Credit: Buy Now, Pay Later, and More
Students explore the concept of consumer credit. In this consumer credit activity, students discuss the costs and benefits of buying with credit. Students examine scenarios to determine the costs and benefits of using a particular method...


