PBS
Pbs Learning Media: Firefighter Training
In this video segment from Cyberchase, Harry decides to train as a firefighter and uses line graphs to chart his physical fitness progress.
Texas Instruments
Texas Instruments: Slippery Slope
In this activity, students will create Distance versus Time plots and calculate the slopes of the plots. They explore the mathematical concept of slopes and understand how slopes can be used to interpret how one physical quantity changes...
Science Education Resource Center at Carleton College
Serc: Discovering Velocity Outside of the Classroom
A physics lab activity where students gather data from classmates running at different rates on a football field. They then share their gathered data and transfer it to a graphing program to ultimately calculate average velocity.
Science and Mathematics Initiative for Learning Enhancement (SMILE)
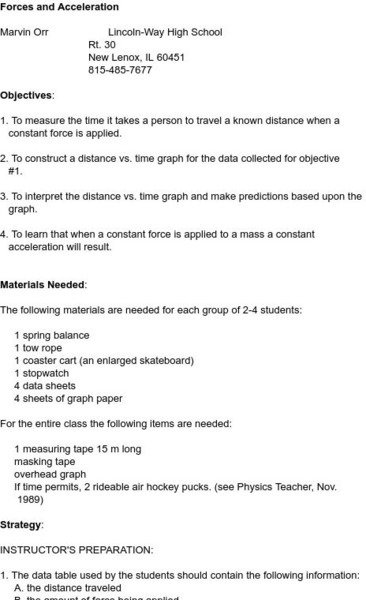
Smile: Lab Work Forces & Acceleration
The Illinois Institute of Technology provides this site. The site contains a graphing activity which illustrates that a constant force exerted upon an object results in constant acceleration. Rolling carts and stopwatches are used to...
Science and Mathematics Initiative for Learning Enhancement (SMILE)
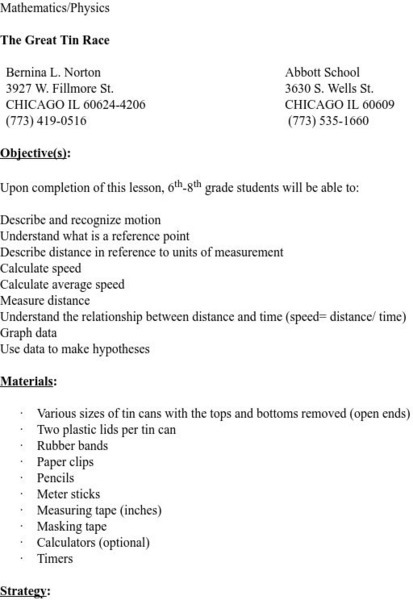
Smile: The Great Tin Race
This activity is a great way to show distance and time relationships while incorporating charts and graphing. Different sized tins are raced against each other, and data is collected.


