Worksheet Web
Using Pictographs
If one ice cream cone represents three ice cream scoops, and Bob has four ice cream cones, then how many scoops does Bob have? Learners solve these kind of questions with their new understanding of pictographs.
Scholastic
Study Jams! Pictograph
An easy and fun way to look at data is with a pictograph. A lesson plan friendly enough for multiple grade levels shows how to set up this graph with a corresponding key. The steps review the importance of choosing an appropriate...
Curated OER
Pictographs
What do these pictographs show? Scholars analyze three sets of data organized into pictographs, filling in several comprehension questions about each. The first one is done for them as an example, but consider going over it together to...
Curated OER
Bar Graphs and Pictographs
How are bar graphs and pictographs different? As you begin this concept, use these simple graphs to help get learners started with data analysis styles. There is one bar graph and one pictograph, each accompanied by four or five...
Curated OER
Pumpkin Picture Graph
In this pumpkin picture graph worksheet, students read and analyze each picture graph and then answer the eight questions that follow.
Math Worksheets 4 Kids
Pictograph Christmas Gifts
Add holiday cheer to math practice with a Christmas themed worksheet designed to reinforce skip counting by two and solving word problems.
Math Worksheets Land
Halloween Interpreting Pictograph
The best part about Halloween is the candy. Individuals read a pictograph that depicts the amount of candy five children received. Then, they respond to five questions using the picture graph to support their answers.
Curated OER
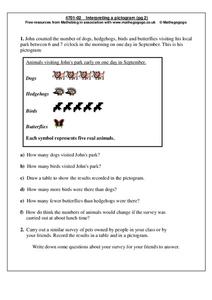
Interpreting a Pictogram
In this pictogram instructional activity, students read and analyze a pictogram about dogs, hedgehogs, birds and butterflies and then answer 6 short answer questions. Students conduct a similar survey on pets owned by their friends and...
Curated OER
Ice Cream Pictograph
Learners create a graph. In this pictograph lesson, students cut out 20 small ice cream cones and decorate them. Learners create a pictograph with their ice cream cones.
Curated OER
Make a Pictograph
In this pictograph instructional activity, 2nd graders create a pictograph involving colors they see the most often in clothing, recording marks and placing those marks in three boxes labeled red, blue and green. Students cut out squares...
Curated OER
Using a Pictograph
For this problem solving worksheet, 5th graders answer four questions using the pictograph provided. The worksheet pertains to sports.
Curated OER
THE EASTER BUNNY GETS READY! PICTURE GRAPH
In this graphing worksheet, students read a picture graph about colors of Easter eggs and then answer questions about the graph.
Curated OER
Gummy Bear Picture Graph
First graders investigate picture graphs. In this graphing lesson, 1st graders create a picture graph with the x-axis being number and the y-axis being color. Students sort their gummy bears by color and use pictures of colored bears...
Curated OER
Tally Chart/Pictograph
In this graphic organizer worksheet, students can record their own data on this tally chart/pictograph. There are two columns and six rows with room for a title.
Curated OER
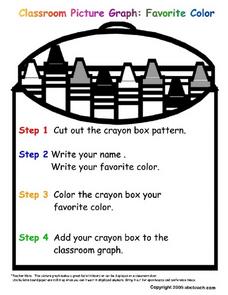
Classroom Picture Graph: Favorite Color
In this picture graph worksheet, 1st graders will cut out a crayon box pattern and write their name and favorite color on it. Then they will color it their favorite color and add to the classroom graph.
Curated OER
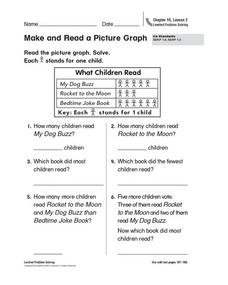
Make and Read a Picture Graph
What books do you like? Have your learners read and interpret a picture graph detailing a fictional class's favorite books. Consider conducting a survey of your learners' favorite books and plotting the results as a class!
Curated OER
Complete the Graphs
First, second, and third graders make pictographs. There are four graphs to complete, and the answer sheet is included. Consider providing your learners with special needs two sets of stickers to use, instead of requiring them to draw...
Curated OER
Where Did the Bunny Leave the Eggs? Picture Graphing Activity
The Easter Bunny left us a bunch of eggs, but how many did he leave? Learners use the data to create a picture graph, interpret it, and answer the questions that follow. There's even easy egg cut-outs for your youngsters!
Curated OER
A Day at the Beach
Let's go to the beach! Danielle, Marty, and Phil collected shells at the beach. Can you determine how many shells each child has? Create a picture graph to make the data easier to understand.
Curated OER
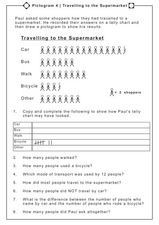
Pictogram 4: Traveling to the Supermarket
In this creating and comprehending a tally chart worksheet, students use a pictograph to tally the number of ways people traveled to the supermarket, tally the results, and answer comprehensive questions. Students answer 8 questions.
Curated OER
Bar Graphs
Introduce scholars to bar graphs and data analysis through analyzing these visual examples. First, they look at a pictograph of fruit types and answer five observation questions. There is one done for them as an example. Learners do the...
Curated OER
Rubber Band Banza
Third graders review ideas about sound and vibration to make their own stringed instrument. They review what a pictograph and bar graph are. Pupils conduct a survey within the classroom to choose the four favorite string instruments and...
Curated OER
Graphs
For beginners to picture graphs this is the perfect resource. They analyze two bar graphs that break down data visually so scholars can actually count the number in each column. For the first, they fill in how many of each type of pet is...
Curated OER
Pictographs
In this pictographs worksheet, 7th graders solve 6 different problems related to the pictograph shown at the top of the sheet. First, they pretend that they counted birds and their numbers are represented in the pictograph. Then,...
Other popular searches
- Bar Graphs Pictographs
- Pictographs and Bar Graphs
- Tally Charts and Pictographs
- Tally Charts or Pictographs.
- Math Pictographs
- Iroquois Indians Pictographs
- Interpreting Pictographs
- Native American Pictographs
- Sioux Indians Pictographs
- Reading Pictographs
- Math, Pictographs
- Math Lessons Pictographs


