Curated OER
Conversation Heart Graphing
Sixth graders review the different types of graphs (bar, line, pictograph) They predict the data set they can garner several boxes of conversation hearts. Students record their data using an Excel spreadsheet. They create a graph based...
Curated OER
Statistics and Probablility
Statistics and Probability are all about collecting, organizing, and interpreting data. Young learners use previously collected data and construct a picture graph of the data on poster board. This stellar lesson should lead to...
Curated OER
Designing a Playground!
Young scholars design their own playground equipment. In this design lesson, students take pictures of equipment they like and make a class pictograph of their favorite ones. They investigate the design, research equipment around the...
Curated OER
Gone Fishing
Students particapate in a lesson on pictographs describing different fish. They observe the columns in the pictographs in order to determine which ones have the most fish and different types of fish. They create their own pictographs.
Curated OER
M&M Graphing and Probability
Students create a variety of graphs. They count, sort, and classify M&M's by color and record data on a chart. They use data from the chart to create pictographs, bar graphs and circle graphs. They analyze data and determine...
Curated OER
How Do You Get Home from School?
First graders create pictographs and interpret results of transportation home from school.
Curated OER
Timed Multiplication Test Graphs
Students use the tools of data analysis for managing information. They solve problems by generating, collecting, organizing, displaying histograms on bar graphs, circle graphs, line graphs, pictographs and charts. Students determine...
Curated OER
Ancient Mesopotamia
Students locate ancient Mesopotamia on a map. They examine the religion, government and the development of writing. They write and draw pictographs and cuneiform writing. They create a class book based on their investigations.
Curated OER
Bald Eagle Population Graphing
Young scholars create graphs to illustrate the bald eagle population. They identify the population of bald eagles in Minnesota and the United States. They create three graphs to represent the population data including a line, bar, and...
Curated OER
Third Grade Math
For this math review worksheet, 3rd graders answer multiple choice questions about probability, bar graphs, pictographs, and more. Students complete 25 multiple choice questions.
Curated OER
Going Bananas: Addition and Graphing
In this addition worksheet, 1st graders will look at a picture to add the total number of bananas a monkey eats per day for five daily sums. Then students will answer four short word problems which require students to view the data as a...
Curated OER
Make a Graph
In this graphing learning exercise, 1st graders use given data to create a graph and answer questions. In this problem solving learning exercise, students solve five problems.
Curated OER
Mesopotamian Tablet, Egyptian Art
First graders examine cuneiform writing from a stone tablet, then write a simple sentence using pictographs. They analyze various examples of Egyptian art, construct a model of an Egyptian boat, and create a class painting using glyphs...
Curated OER
Squigly's Secret Code
In this literacy worksheet, learners work to unscramble the secret code. The code is written in symbols that are similar to pictographs.
Curated OER
Pictograph Robe Stories
Fourth graders explore the diversity and commonality of human interdependence. Also, the global cooperation of the people of the United States and the world through a multicultural and historical perspective. They describe the...
Curated OER
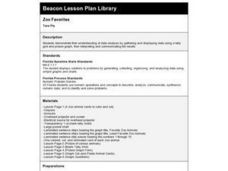
Zoo Favorites
First graders construct a class picture graph and tally grid that show their favorite zoo animals. They discuss the information the graphs show and complete a personal graph based on the class example.
Curated OER
Pictogram 1 and 2
In this mathematical worksheet, learners experience problem solving two pictograms dealing with favorite animals and rainy days.
Curated OER
"Eggs-ploring" Math with Jellybeans
Learners work in pairs with a small bag of jellybeans to estimate the number of candies in their bags and then figure out how many groups of 10 jellybeans are contained in their bags. They then graph the information using a pictograph or...
Curated OER
Science: Teddy Bear Nation
Students sort teddy bears according to types and then graph the results. They each bring a bear to class and then discuss their similarities and differences. Once the bears have been sorted into groups according to size and color,...
Growing Minds
Growing Minds: Cabbage Exploration
It's all about cabbage in this scientific observation resource! After reading a related story, learners explore three varieties of cabbage. They observe the leaves using a leaf diagram, predicting what the middle might look like. They...
Florida Center for Reading Research
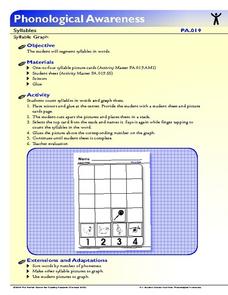
Phonological Awareness: Syllables, Syllable Graph
Scholars make a pictograph based on the number of syllables in each picture card. They choose a card, say the name of the object on the card, break the word into syllables, count the syllables, then glue the picture onto the number chart...
Royal Society of Chemistry
Hazard Symbols
Starting in 2015, all chemicals must have a pictogram of the associated chemical hazards. A brain-building activity reviews four of the basic symbols found in a typical science laboratory. Through a fun puzzle, scholars apply their...
Curated OER
Data Analysis: For Little Learners
Using pictographs, tally charts, and surveys, kids learn all about data analysis and collection. They make surveys, collect data, then construct pictographs and tally charts to organize their information.
Curated OER
Graphs and money
In this graphs and money worksheet, students complete word problems about different kinds of graphs and money in those graphs. Students complete 10 multiple choice problems.


