Curated OER
Reading Graphs
Students read graphs and charts to interpret results. In this algebra lesson, students interpret bar, line and pictographs. They draw conclusions and make predicitons based on these charts.
Curated OER
Jellybean Graphs
Second graders predict and graph data based on the color of jelly beans they think are in a handful. In this prediction lesson plan, 2nd graders will predict how many of each color jellybean are in a handful. Then they graph these...
Curated OER
Statistics and Probablility
Statistics and Probability are all about collecting, organizing, and interpreting data. Young learners use previously collected data and construct a picture graph of the data on poster board. This stellar lesson should lead to...
Curated OER
Collecting Data
In this data collection worksheet, students read about how data is collected and organized. They also learn about a hypothesis. Students read through examples of different charts and then answer 23 questions pertaining to data...
Curated OER
Graphing Fun In Third Grade
Third graders display information in a graph, table, and chart. In this data lesson plan, 3rd graders look at graphs, tables, and charts, discuss their importance, and make their own.
Curated OER
Where Do I Fit on the Graph?
Students collect data and create graphs about themselves, their community, and the world around them. They use a variety of methods to organize data, such as stickers, clothespins, name tags, coloring, tally marks, etc.
Curated OER
Creating a Graph
Students brainstorm favorite things to do during the summer. They survey classmates to collect data, arrange it in a chart, and create graphs using ClarisWorks.
Curated OER
"Graph It"
Students work in teams to conduct short surveys of their classmates. They show their results using at least two different types of graphs.
Students separate into teams and are asked that each team to choose something that they are...
Curated OER
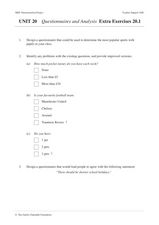
Unit 20 Questionnaires and Analysis Extra Exercises 20.1
In this statistics instructional activity, students design a biased questionnaire. They create data displays based on given statistics. There are a total of 9 problems.
Curated OER
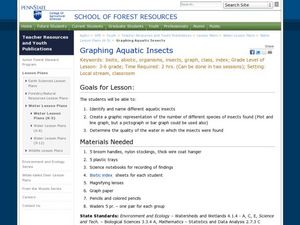
Graphing Aquatic Insects
Students identify aquatic insects. In this organism lesson, students locate aquatic insects near a local waterway and collect them. Students graph the amount of insects that they collected.
Curated OER
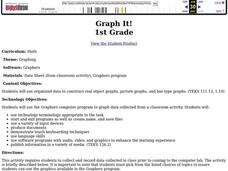
Graph It!
First graders use organized data to construct real object graphs, picture graphs, and bar-type graphs.
Curated OER
Third Grade Math
For this math review worksheet, 3rd graders answer multiple choice questions about probability, bar graphs, pictographs, and more. Students complete 25 multiple choice questions.
Curated OER
Can You Measure Up?
Here is a well-designed lesson on common standards of measurement for your young mathematicians. In it, learners calculate measurements in standard and non-standard units. They make predictions, record data, and construct and design...
Curated OER
Data Analysis, Probability, and Discrete Mathematics
Fourth graders analyze the data in a bar graph, pictograph, line graph, and a chart/table and draw conclusions based on the data. They discuss each type of graph, write questions for each graph, and analyze the data as a class.
Curated OER
Pancakes, Anyone?
First graders explore data collecting and graphing. In this data collecting and graping lesson, 1st graders watch a video about monster who sells pancakes. Students make a graph to record the most popular pancake. Students also play...
Curated OER
Flight of Angles of Inclination
Students measure the flight of a gilder. In this fight of angles lesson, students explore the flight of a glider and measure the distance flown. They collect statistical data of the flights and determine the slope of each flight. ...
Curated OER
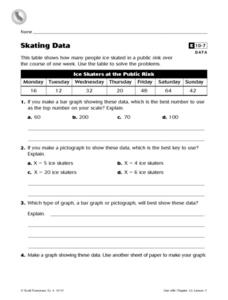
Skating Data
In this collecting data worksheet, 4th graders view a table on ice skaters at a public rink in order to answer 2 multiple choice questions, 1 short answer question and make a graph showing one piece of the data.
Curated OER
Technology Literacy Challenge Grant Learning Unit
First graders explore counting and classification. They sort leaves, create graphs, write sentences for the data in the graphs, develop graphs for shapes, favorite animals, birthdays, and participate in a die prediction game.
Curated OER
Gingerbread Man Math
Students collect and explore gingerbread man data. In this math and technology lesson plan, students examine how to organize and interpret data in three formats: objects, pictures, and graphs.
Curated OER
Can You Count on Cans?
How can a canned food drive be connected to math? It's as simple as counting and organizing the cans! Children demonstrate their ability to sort non-perishable foods into categories that include soup cans, vegetable cans, boxed items,...
Curated OER
Let's Graph It
In this let's graph it worksheet, student interactively answer 10 multiple choice questions about graphing data and types of graphs, then click to check their answers.
Curated OER
Candy Bar Survey
Second graders investigate the skill of graphing data by using candy bars to create context for the lesson. They use technology for graphing and organizing information like a spreadsheet. The lesson includes a resource link to aid in the...
Curated OER
Getting A Grip On Graphs
Fourth graders investigate the concept of graphing and comparing different types of data using pictographs, line graphs, scatter plots, etc... They gather data and make interpretations while examining the medium of how it is displayed.


