Curated OER
Graphing Absolute value Inequalities
Students investigate the concept of inequalities and practice graphing them at various degrees of difficulty. They review the basic rules with the teacher at the level of theory which may make it harder for them to understand without...
Curated OER
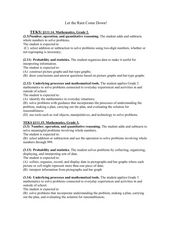
Let the Rain Come Down!
Second graders construct a bar graph comparing local precipitation to that of the Yucatan. In this graphing lesson, 2nd graders will use conversions and problem solving strategies.
Curated OER
Graphs Galore
Fourth graders conduct surveys to collect data. They analyze and interpret the data, then determine which type of graph is appropriate for the data. Students use the data to make predictions, discover patterns and draw conclusions...
Curated OER
Getting A Grip On Graphs
Fourth graders investigate the concept of graphing and comparing different types of data using pictographs, line graphs, scatter plots, etc... They gather data and make interpretations while examining the medium of how it is displayed.
Curated OER
Creating Line Graphs
High schoolers draw line graphs. In this math instructional activity, students interpret minimum wage data and graph the data in a line graph. High schoolers predict the next minimum wage and figure the earnings for a 40 hour work week...
Curated OER
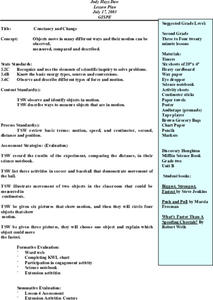
Constancy and Change
Second graders investigate how objects can move in different ways. They move in different ways across the room and develop a class list of movement words. Students also conduct a measuring motion experiment, create a bar graph for the...
Curated OER
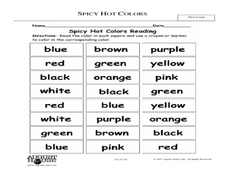
Spicy, Hot Colors
Students demonstrate an understanding of colors. In this visual arts instructional activity, students read the text Hot, Spicy Colors and name their favorite colors. Students complete a bar graph to show the data. Students discuss how...
Curated OER
Graphing Favorite Colors
Third graders collect data and insert it into ClarisWorks to create a spreadsheet/graph of their favorite color. They interpret the data together.
Curated OER
Quarter, Nickel, Dime....
An engaging game called, "Quarter, Nickel, and Dime" is presented in this math lesson. Players are given an envelope with slips of paper that represent the three coins. In pairs, they play the game 18 times, and the whole class charts...
Curated OER
Weather Graphs
First graders use their knowledge of weather symbols to organize and construct a graph of the daily weather for one month. Each student have a chance to give the daily weather report using Sammy's Science House Computer Software.
Curated OER
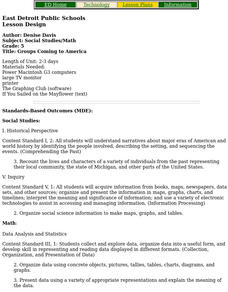
Groups Coming to America
Fifth graders use text or other references to locate different types of information about the Mayflower and pilgrims. They create a presentation for lower elementary classes about the Pilgrims.
Shodor Education Foundation
Data Flyer
Fit functions to data by using an interactive app. Individuals plot a scatter plot and then fit lines of best fit and regression curves to the data. The use of an app gives learners the opportunity to try out different functions to see...
Curated OER
Gummy Bear Picture Graph
First graders investigate picture graphs. In this graphing lesson, 1st graders create a picture graph with the x-axis being number and the y-axis being color. Students sort their gummy bears by color and use pictures of colored bears...
Curated OER
Pictures of Data
In this data instructional activity, students look at maps and charts and answer multiple choice questions about them. Students complete 10 questions.
Curated OER
"Favorite Fairy Tale Characters"
Third graders enter the results of their survey on a spreadsheet. They construct a bar graph showing the results.
K12 Reader
Displaying Data
It's important to learn how to display data to make the information easier for people to understand. A reading activity prompts kids to use context clues to answer five comprehension questions after reading several paragraphs about...
Curated OER
A Birthday Basket for Tia
Students practice reading and math skills using technology. In this main idea lesson, students retell the important events of A Birthday for Tia in sequence using Kid Pix. Students create a bar graph using The Graph Club...
Curated OER
Halloween Candy/ Sugar Content
Fourth graders examine the amount of sugar contained in Halloween candy by looking at nutritional labels from candy bars. They figure out ways to encourage people to reduce the amount of sugar they eat at this holiday. They look at the...
Curated OER
Testing Battery Combinations
Fourth graders examine the required combinations of plates and predict which combination will generate the most and least current and voltage. They use an ammeter and experiment with combinations of their own testing and record each...
ESL Kid Stuff
Clothes
How would your kids react if they saw a big pile of clothes in the middle of their classroom? Learn about different types of clothes with a lesson that includes songs, games, and a fun dress-up activity.
Curated OER
Woodland Math Facts
For this Woodland math facts worksheet, students study and examine woodland weights of trees and shrubs, explore invertebrates and draw a bar chart to chart their findings.
Super Duper Publications
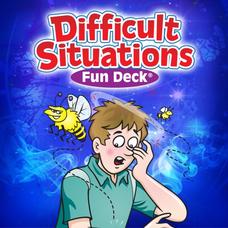
Difficult Situations Fun Deck
What would you do? Fifty-six illustrated picture flash cards provide players with an opportunity to talk about difficult situations, practice responses to awkward or uncomfortable situations, and consider how to deal with dangerous...
Math Mammoth
Grade 1 Worktext
Use graphing, counting, and number lines to help first graders learn about addition and subtraction. An array of worksheets and activities are an excellent resource for your math lesson, whether you are focusing on counting skills...
Curated OER
Organizing Data
In this tally chart worksheet, students complete a tally chart of the number of each animal they see in the picture and answer short answer questions about it. Students complete the chart for 5 animals and answer 3 questions.


